
Below, you will find samples of my coursework and skills involving Geographic Information Science and cartography.
These maps were made for an Advanced Cartography class. They display poverty data from Hartford County, Connecticut in three different ways and are a good example of fitting a lot of information in a small space.
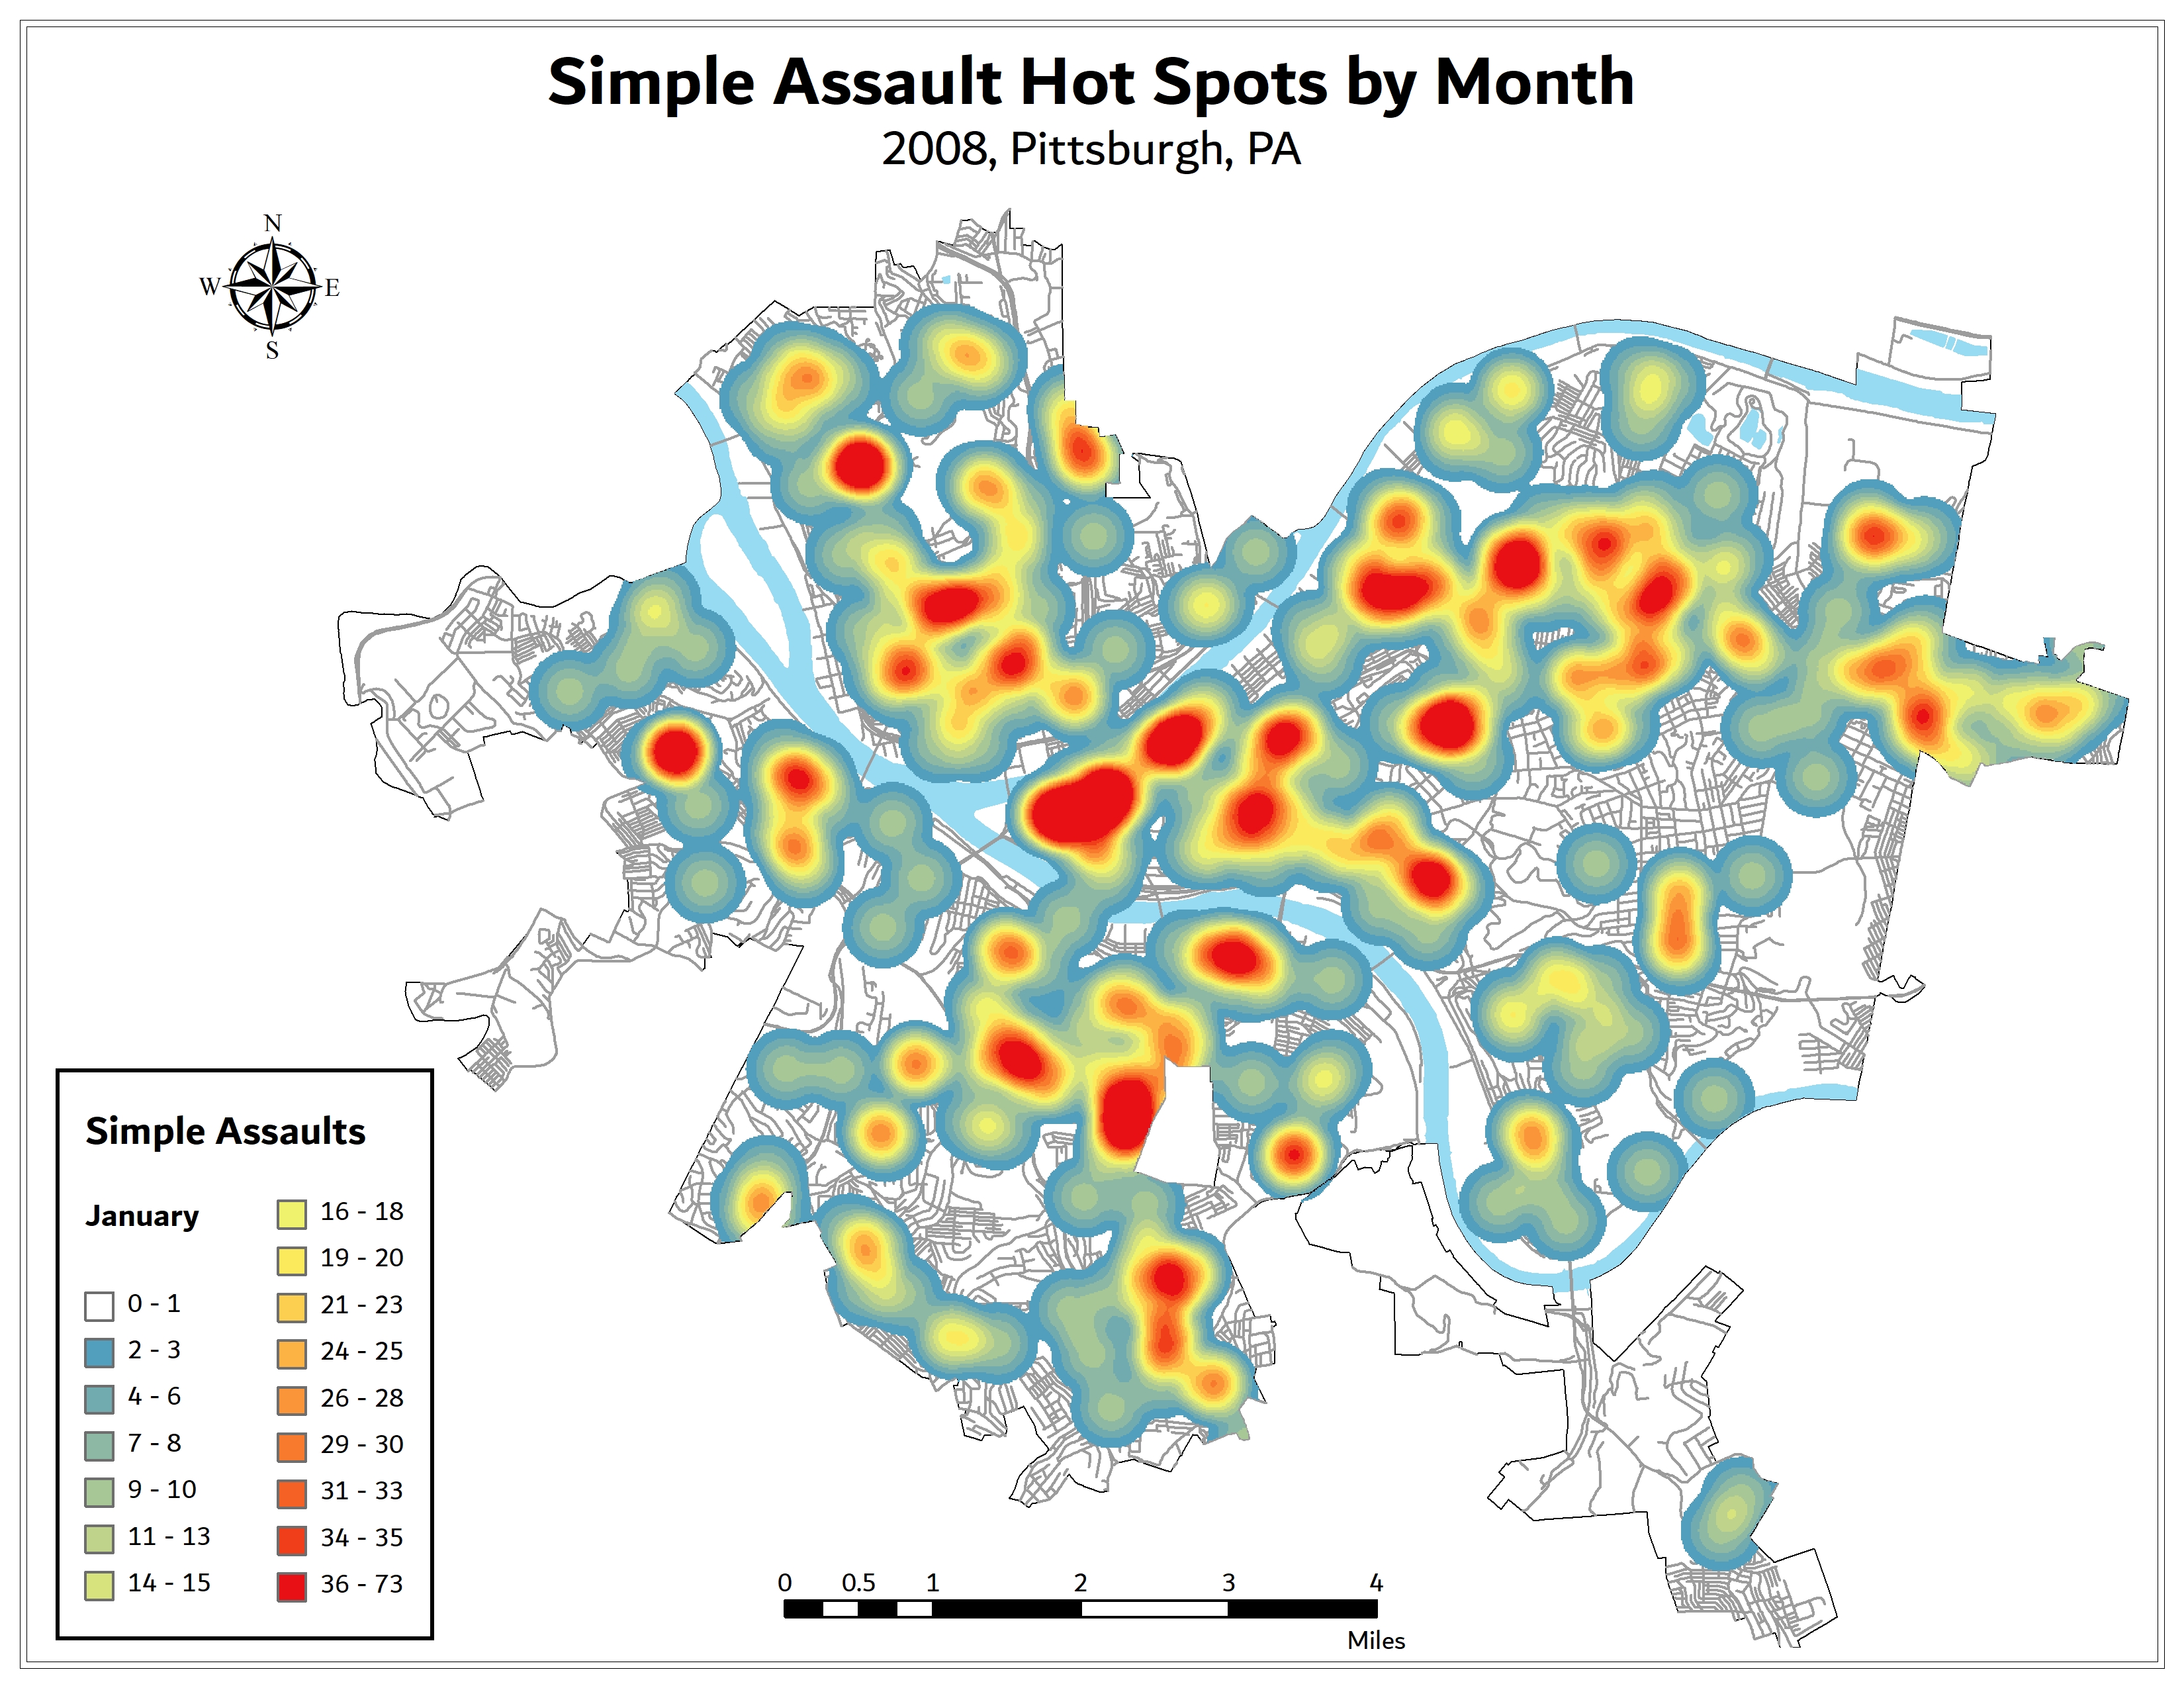
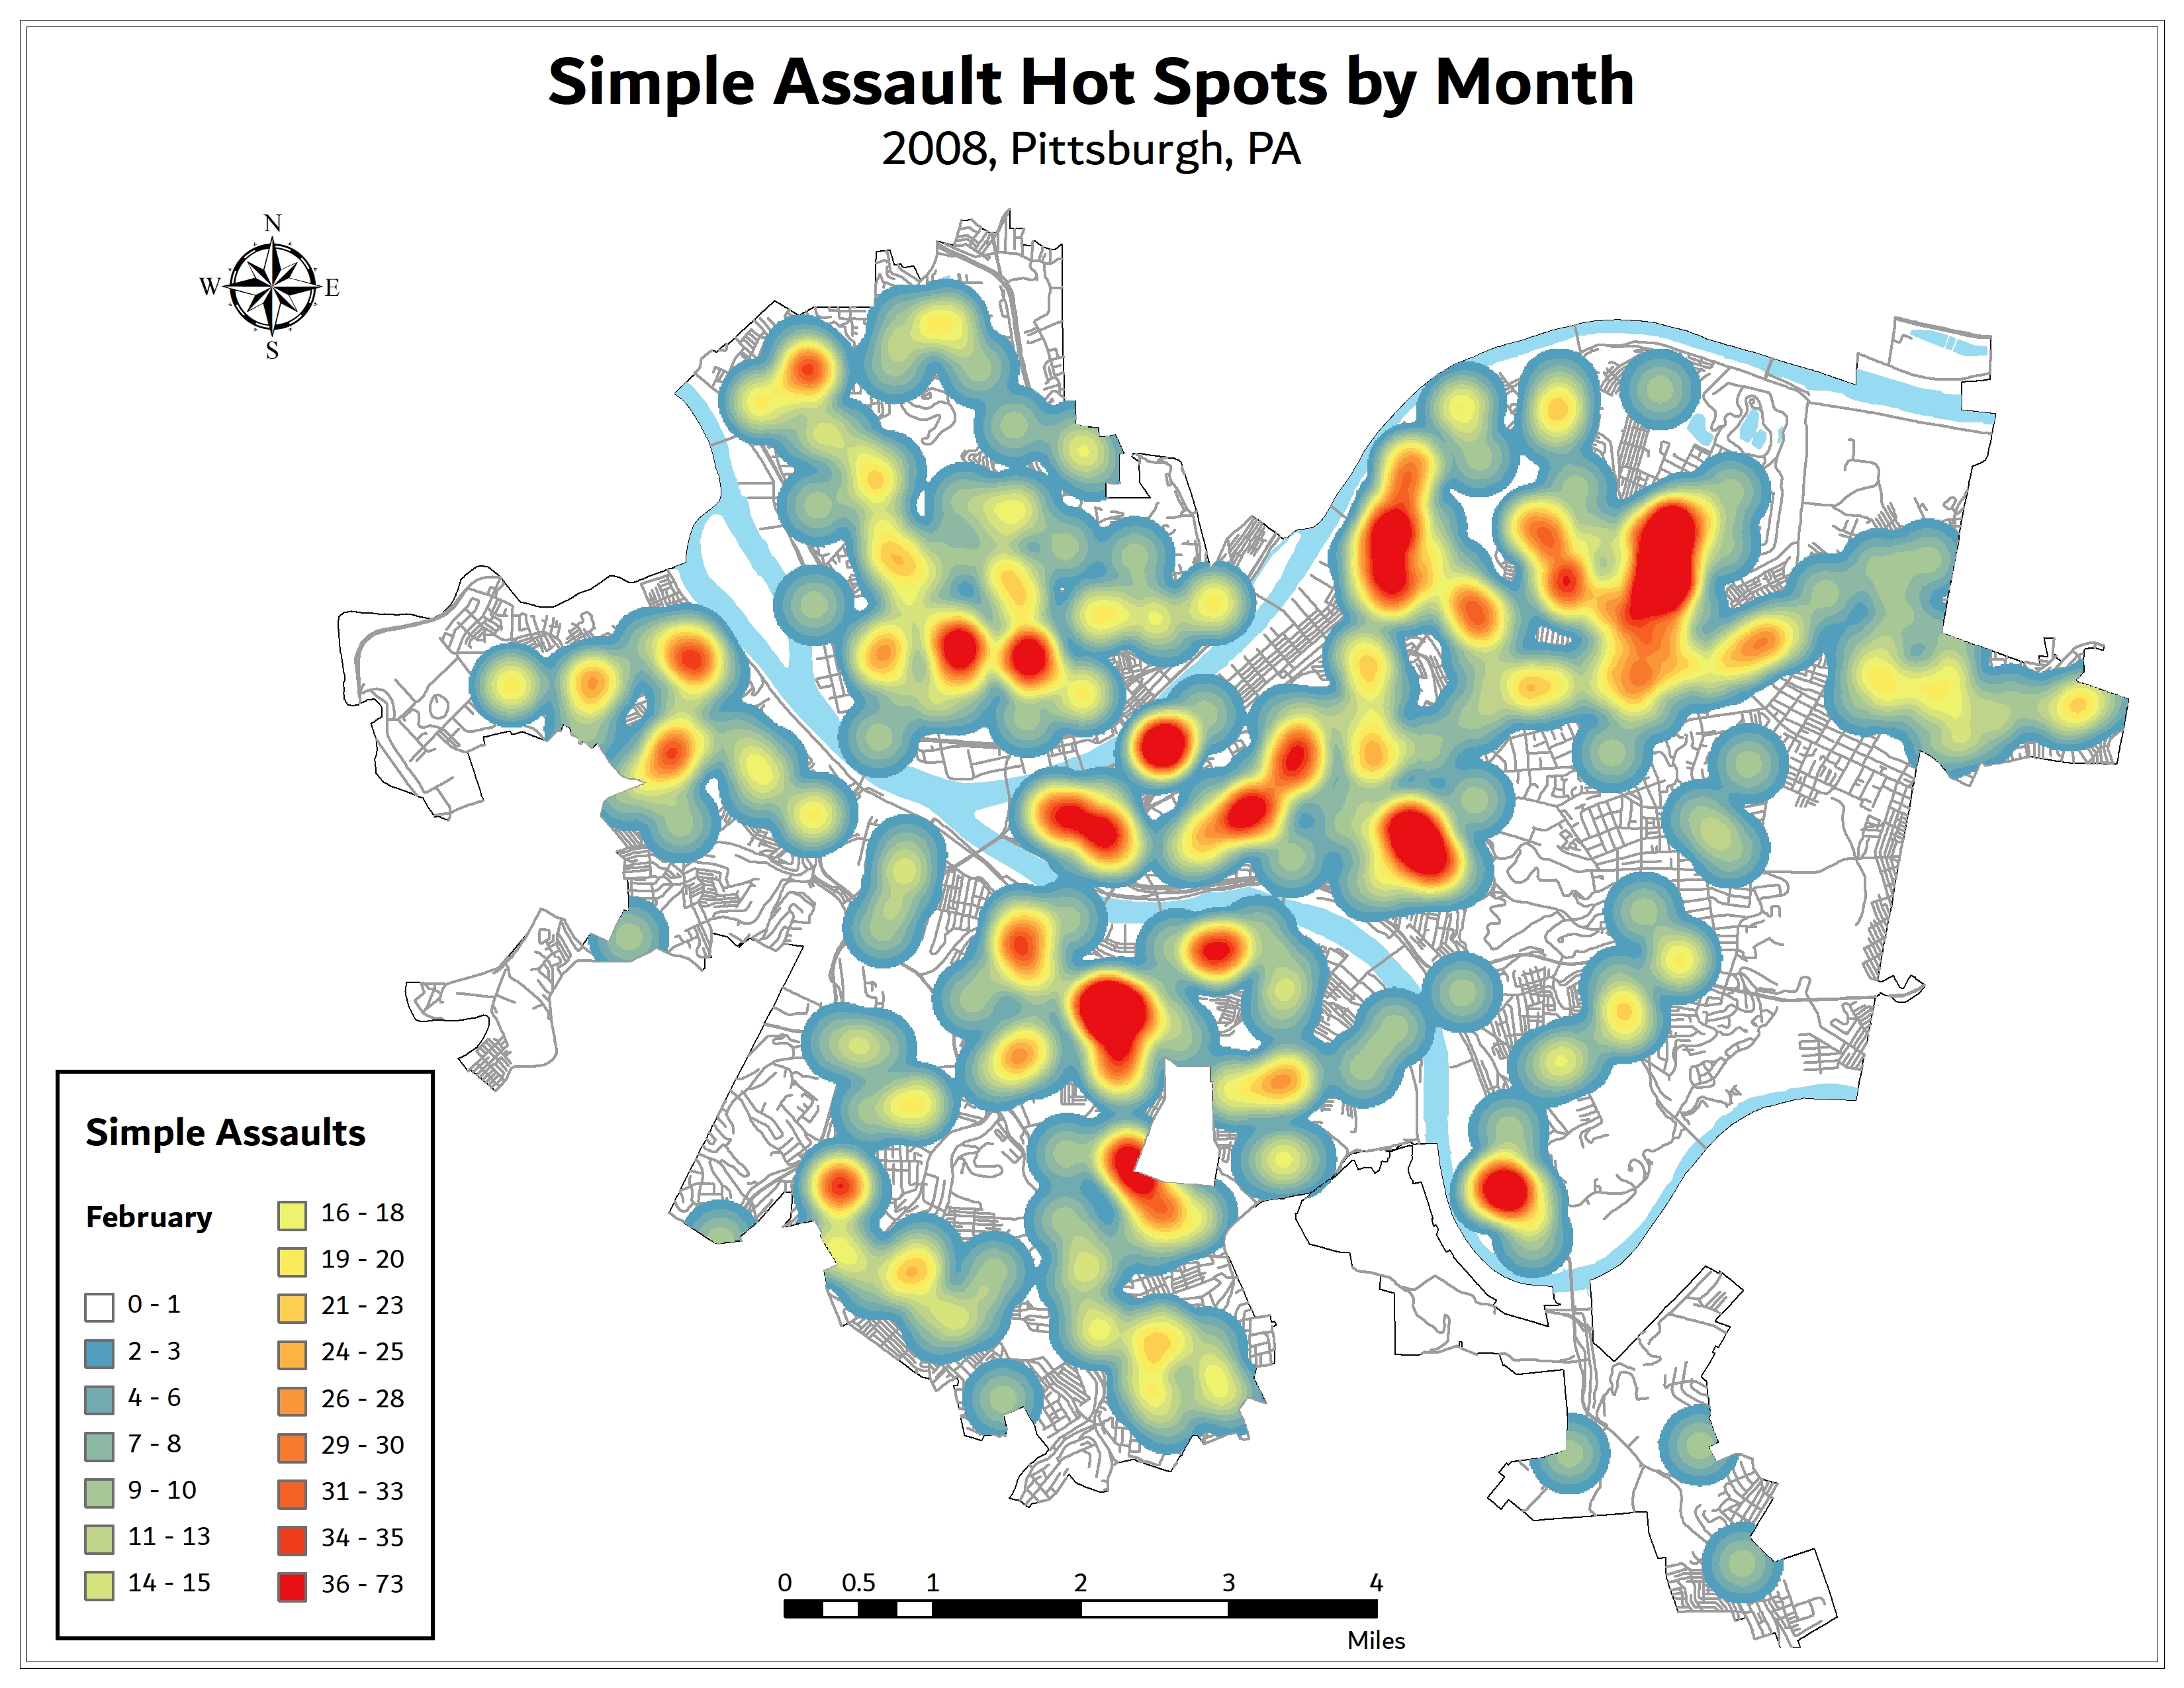
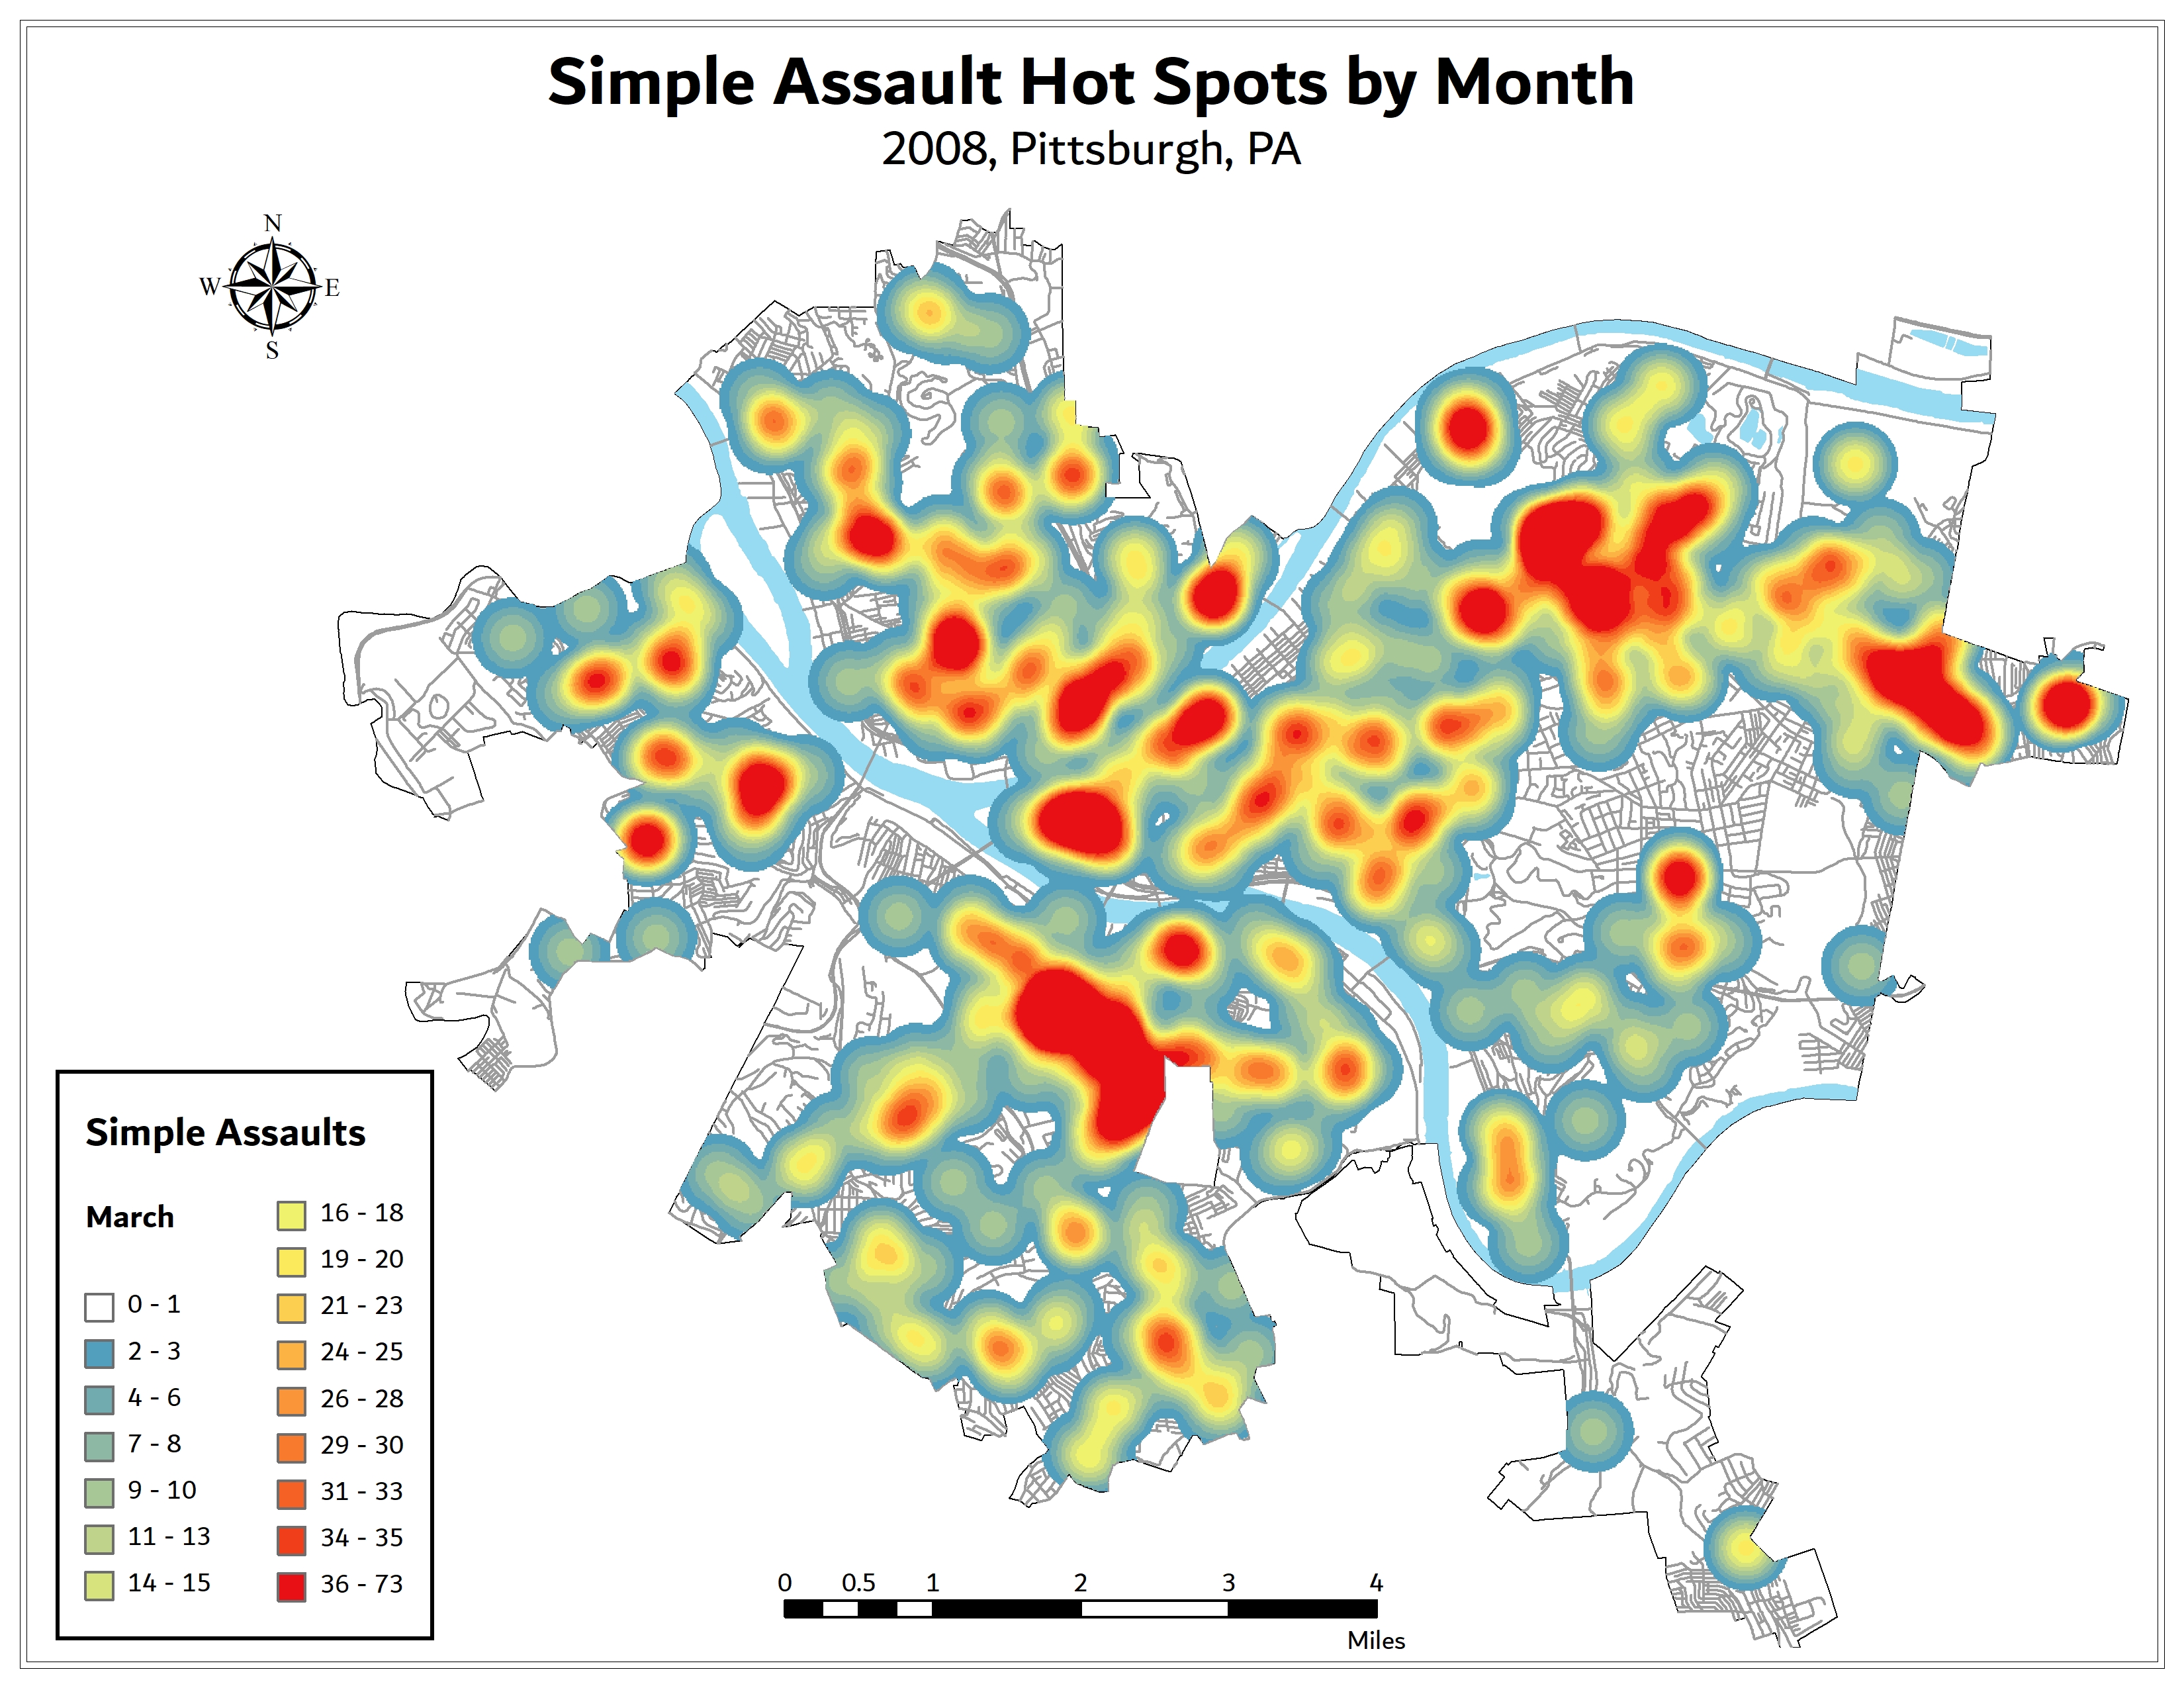
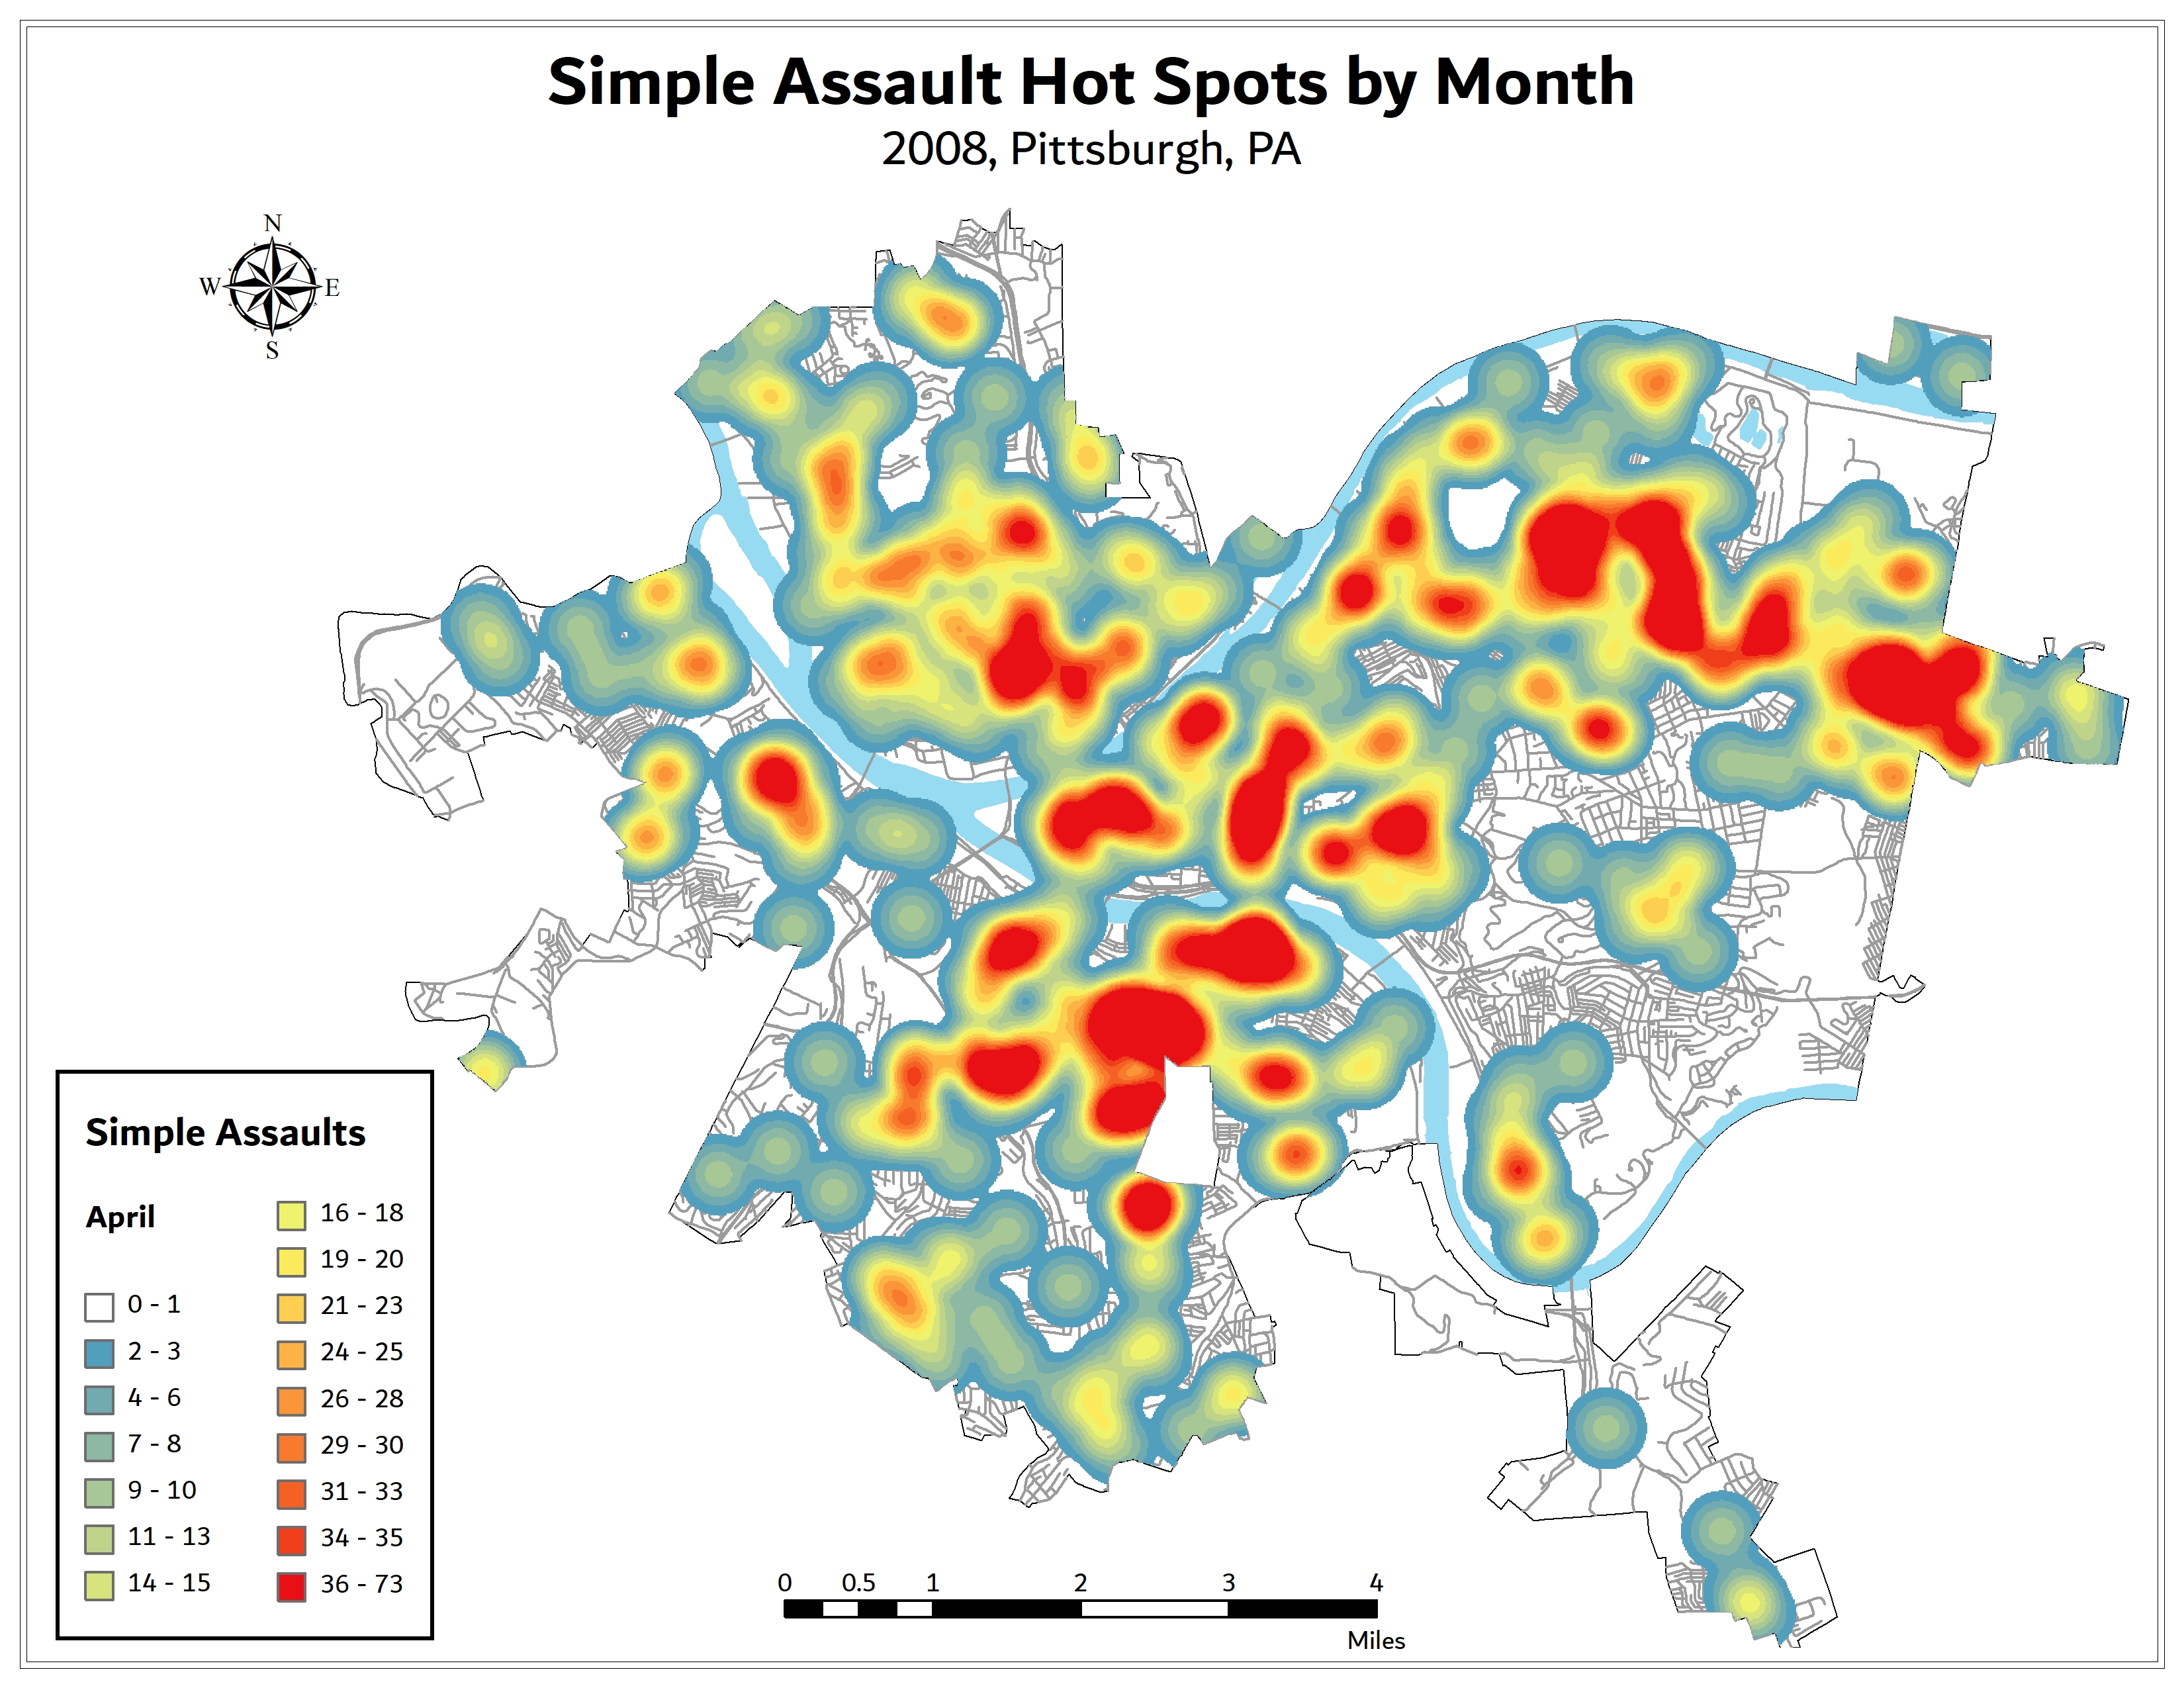
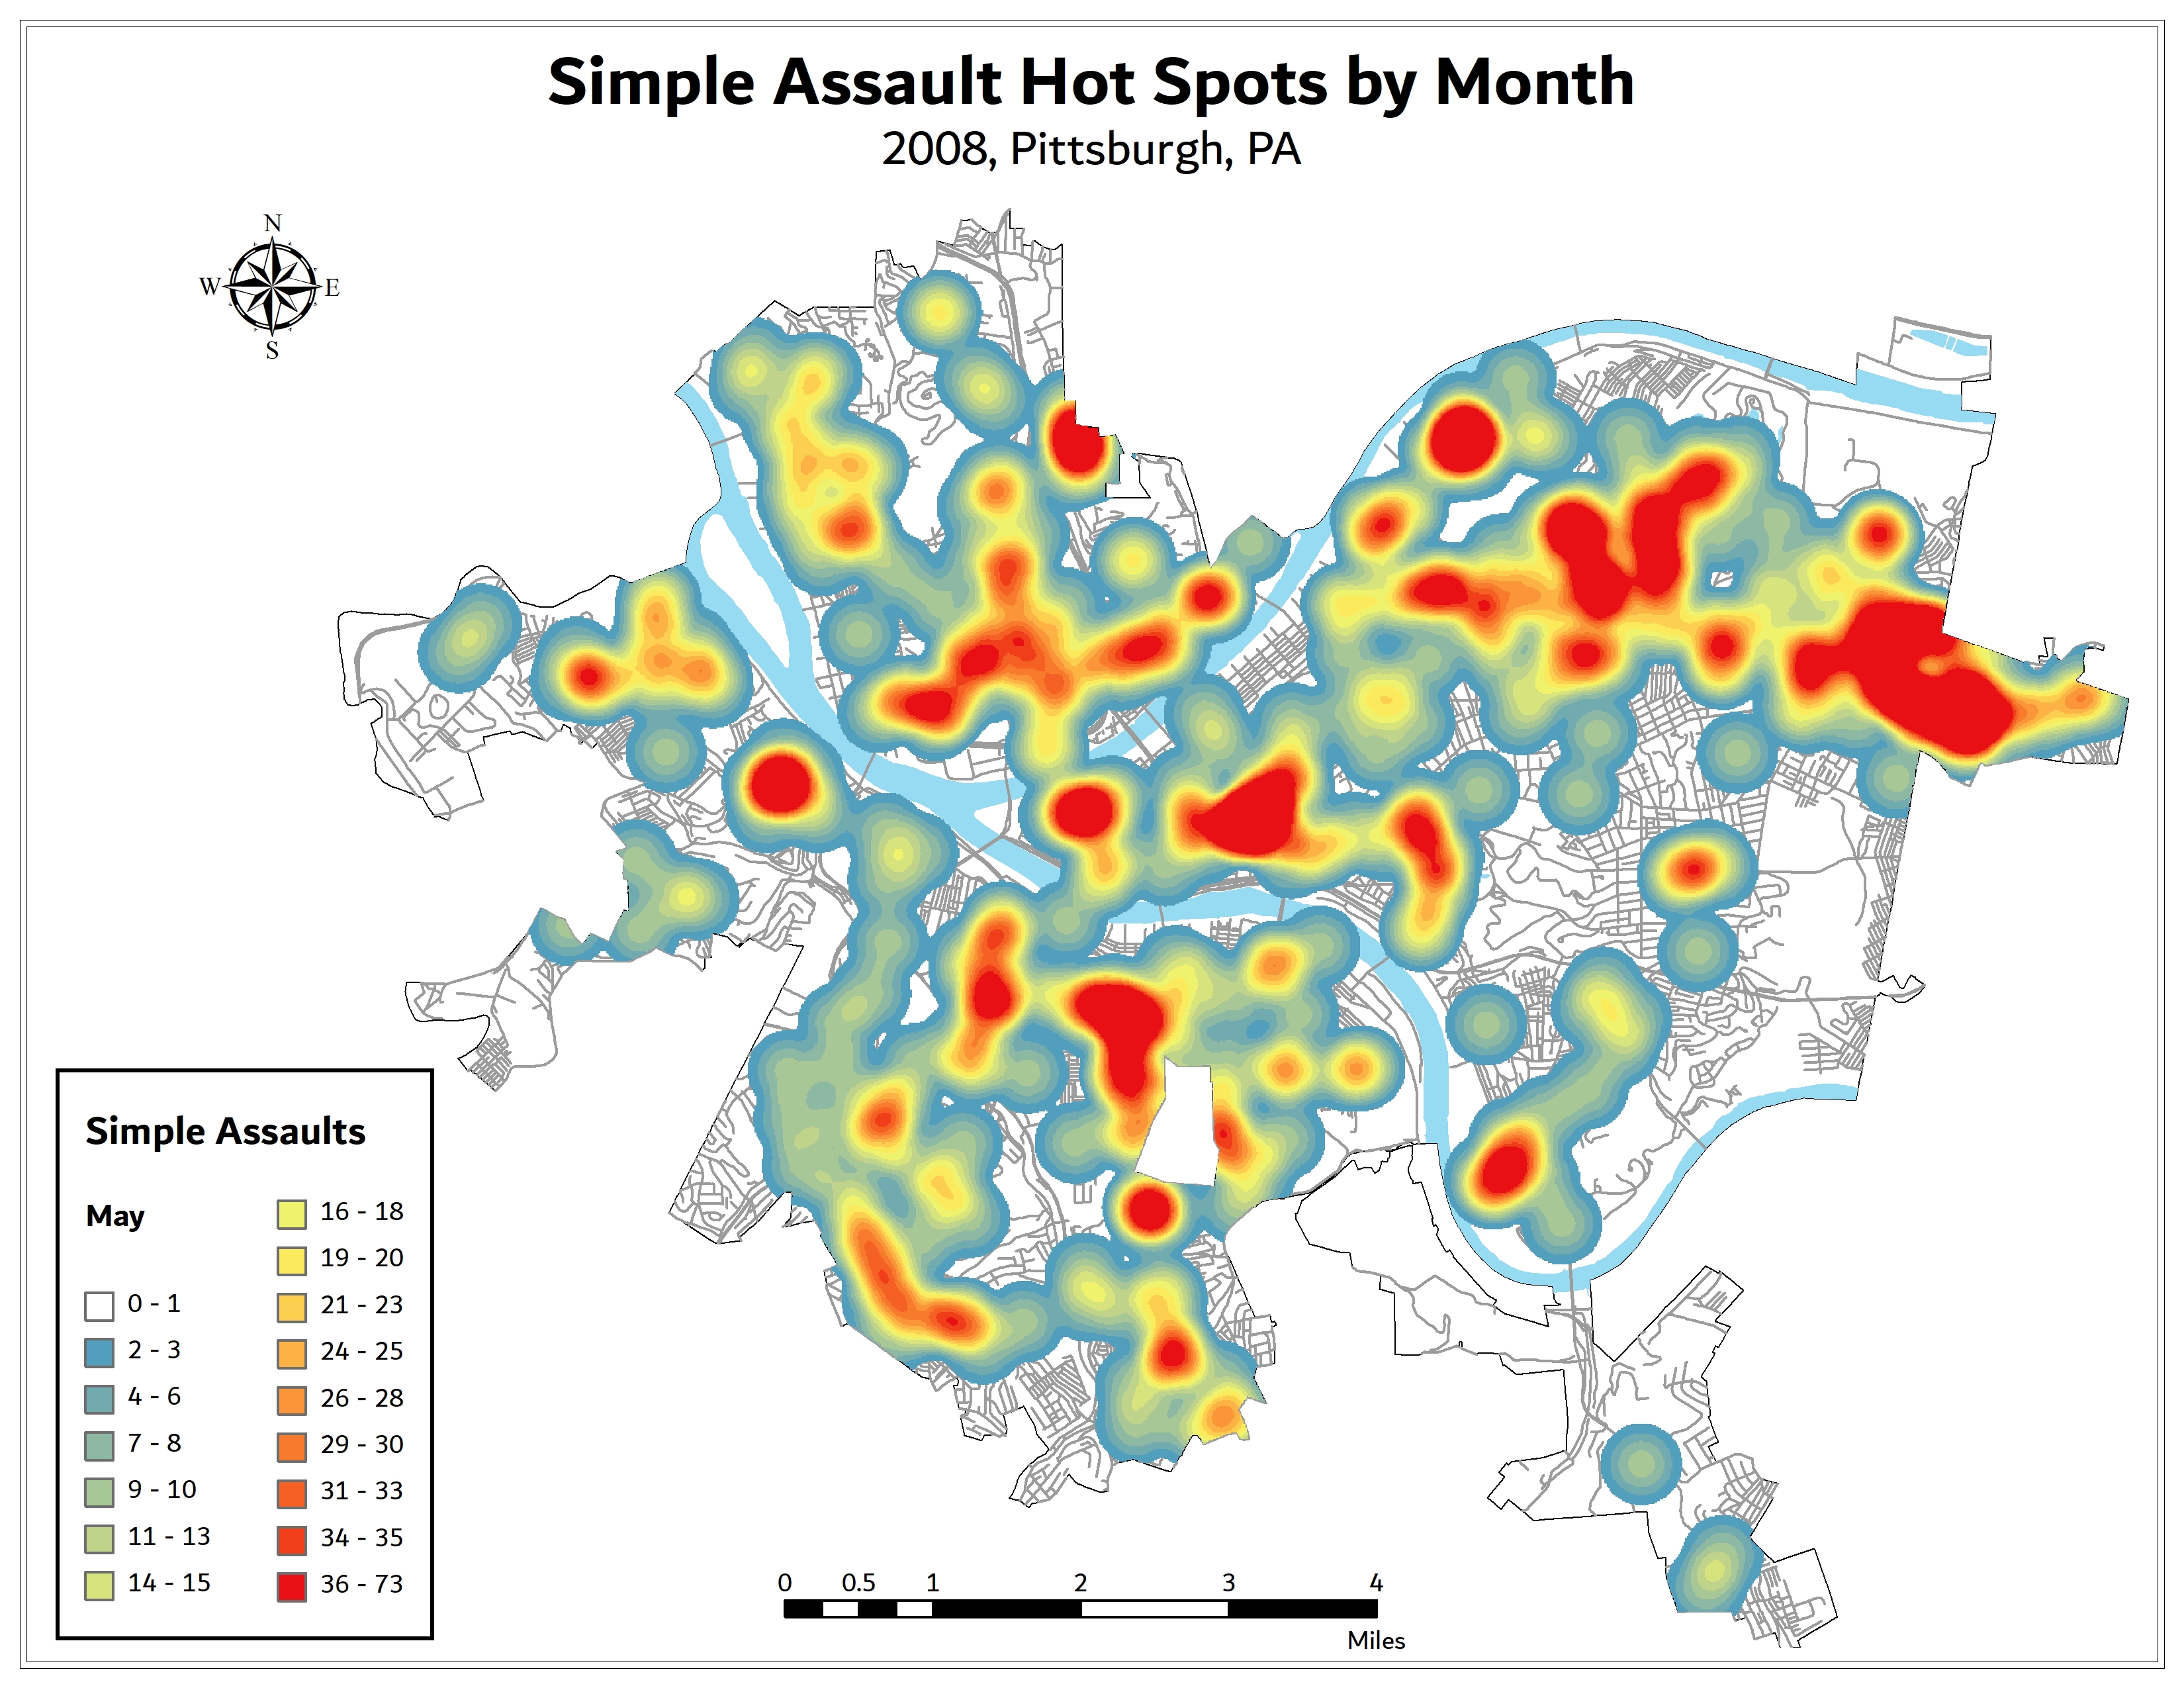
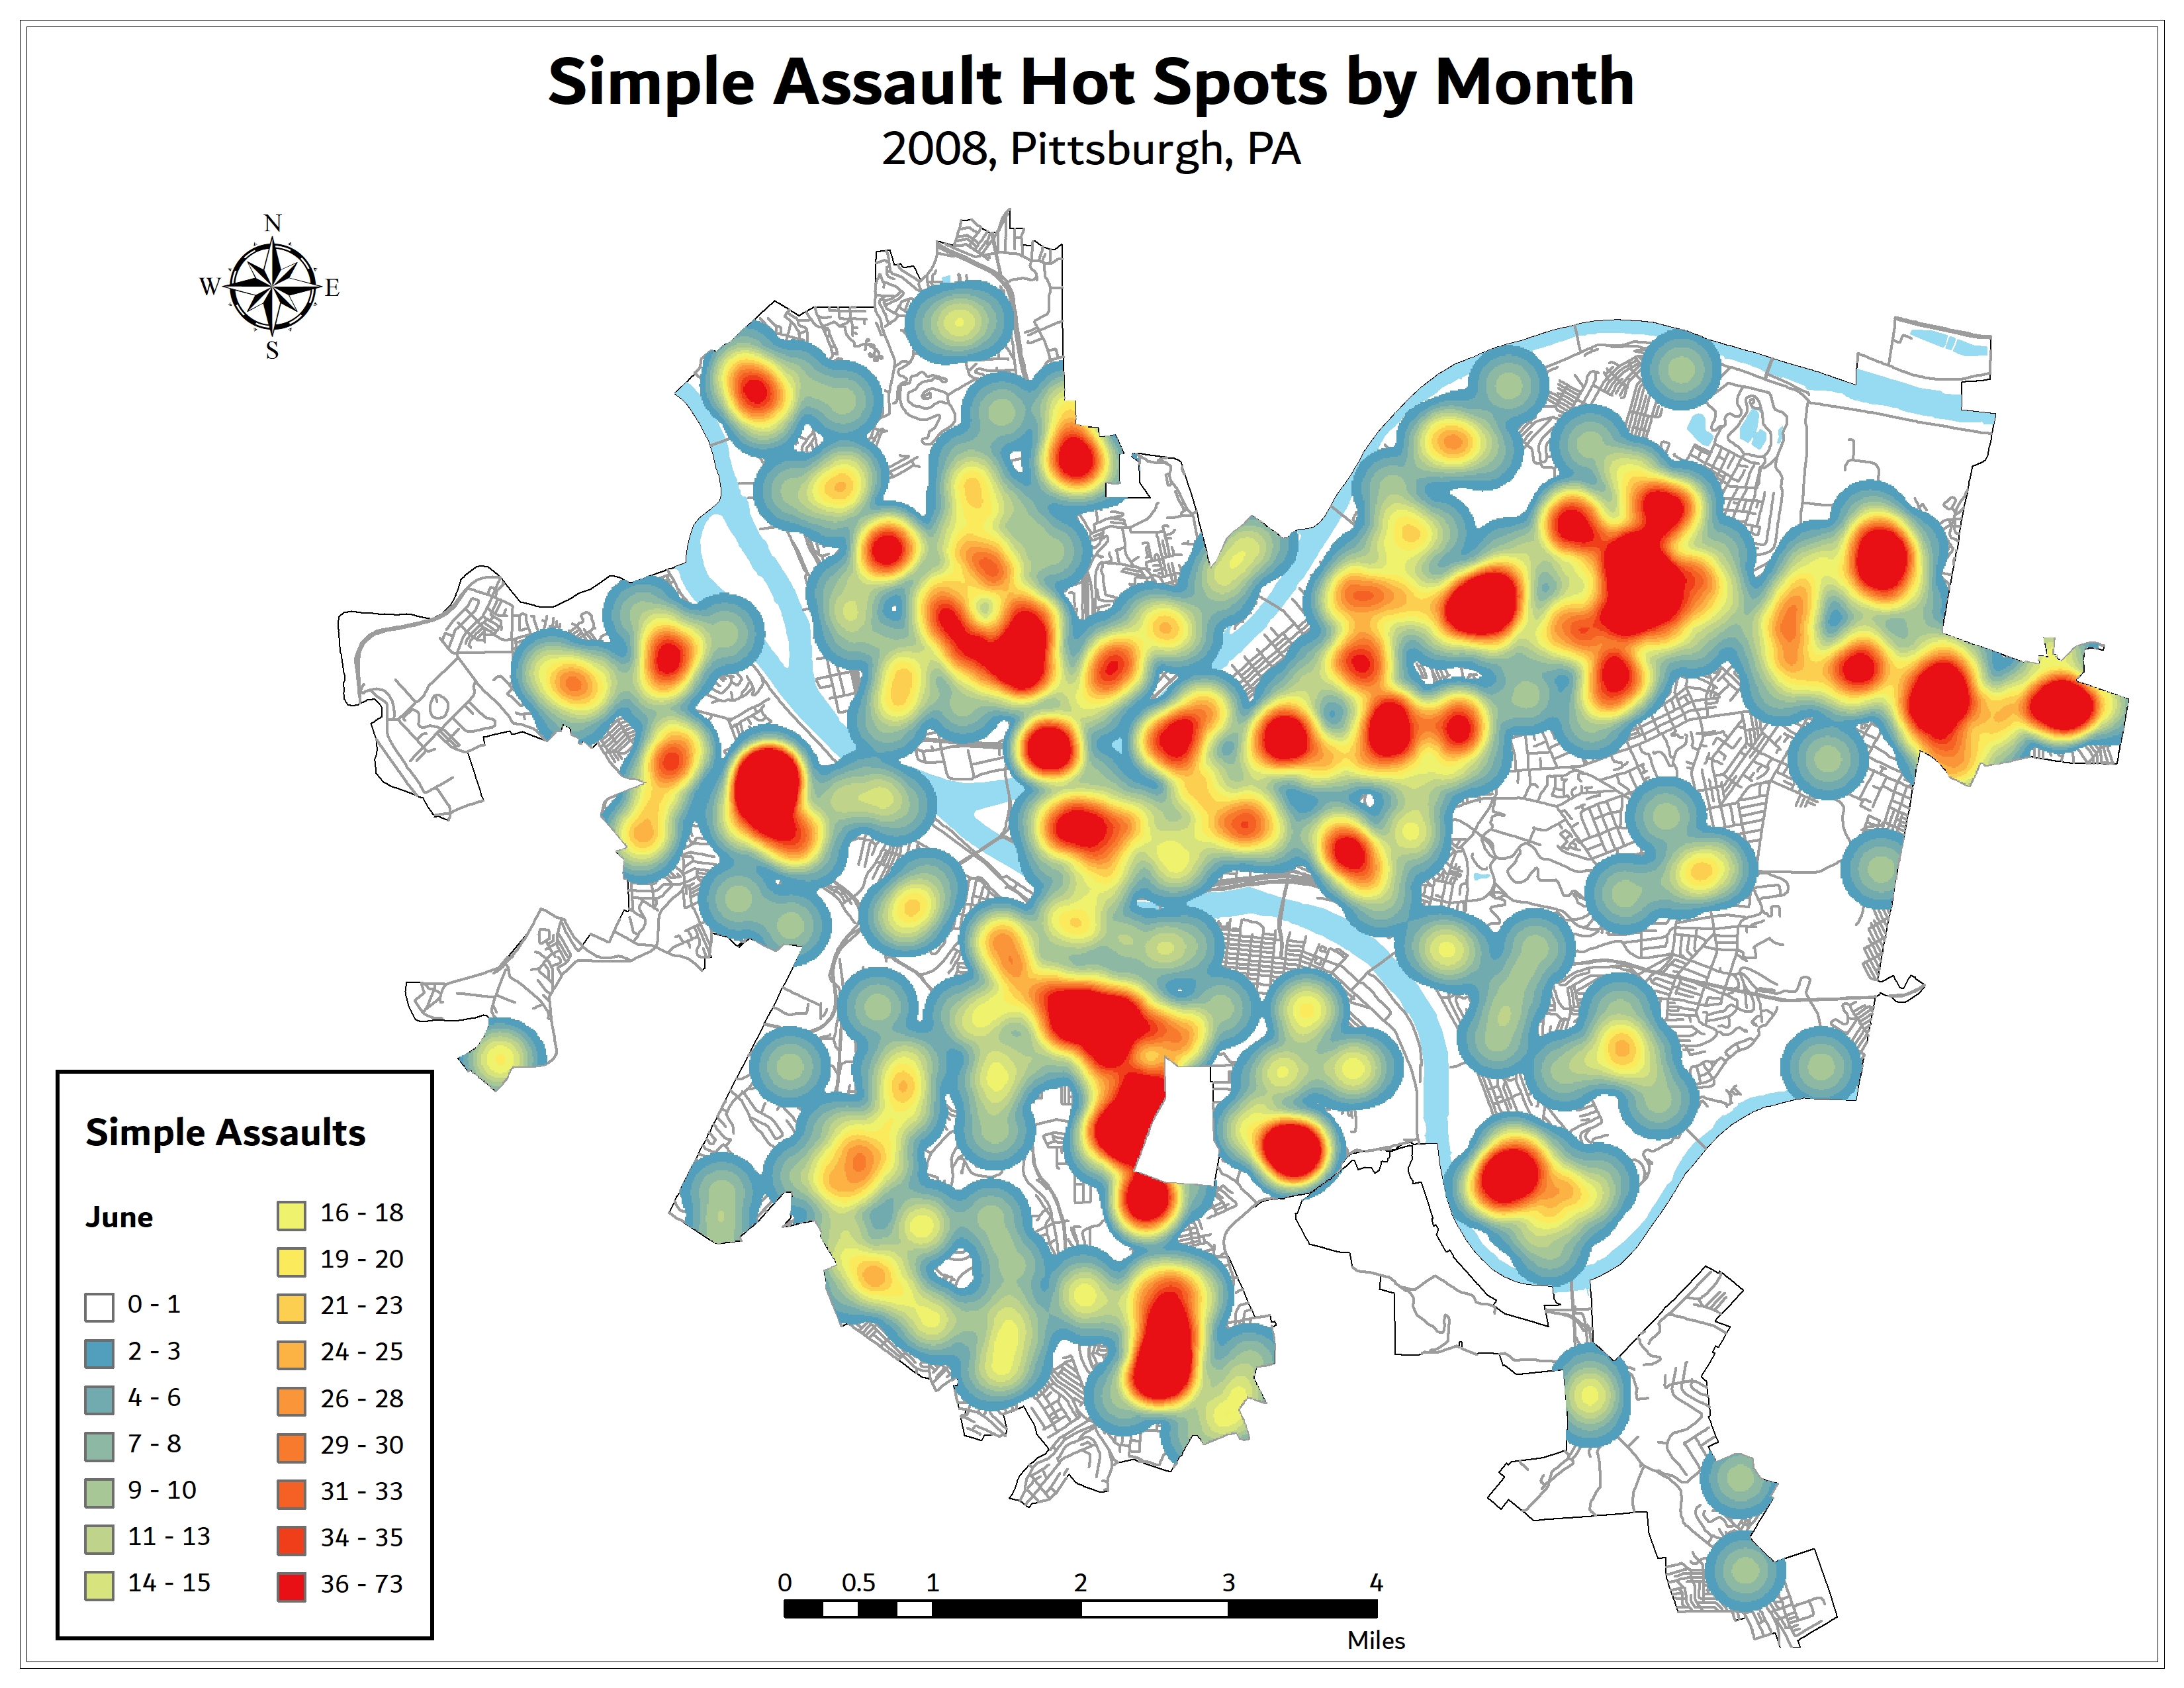
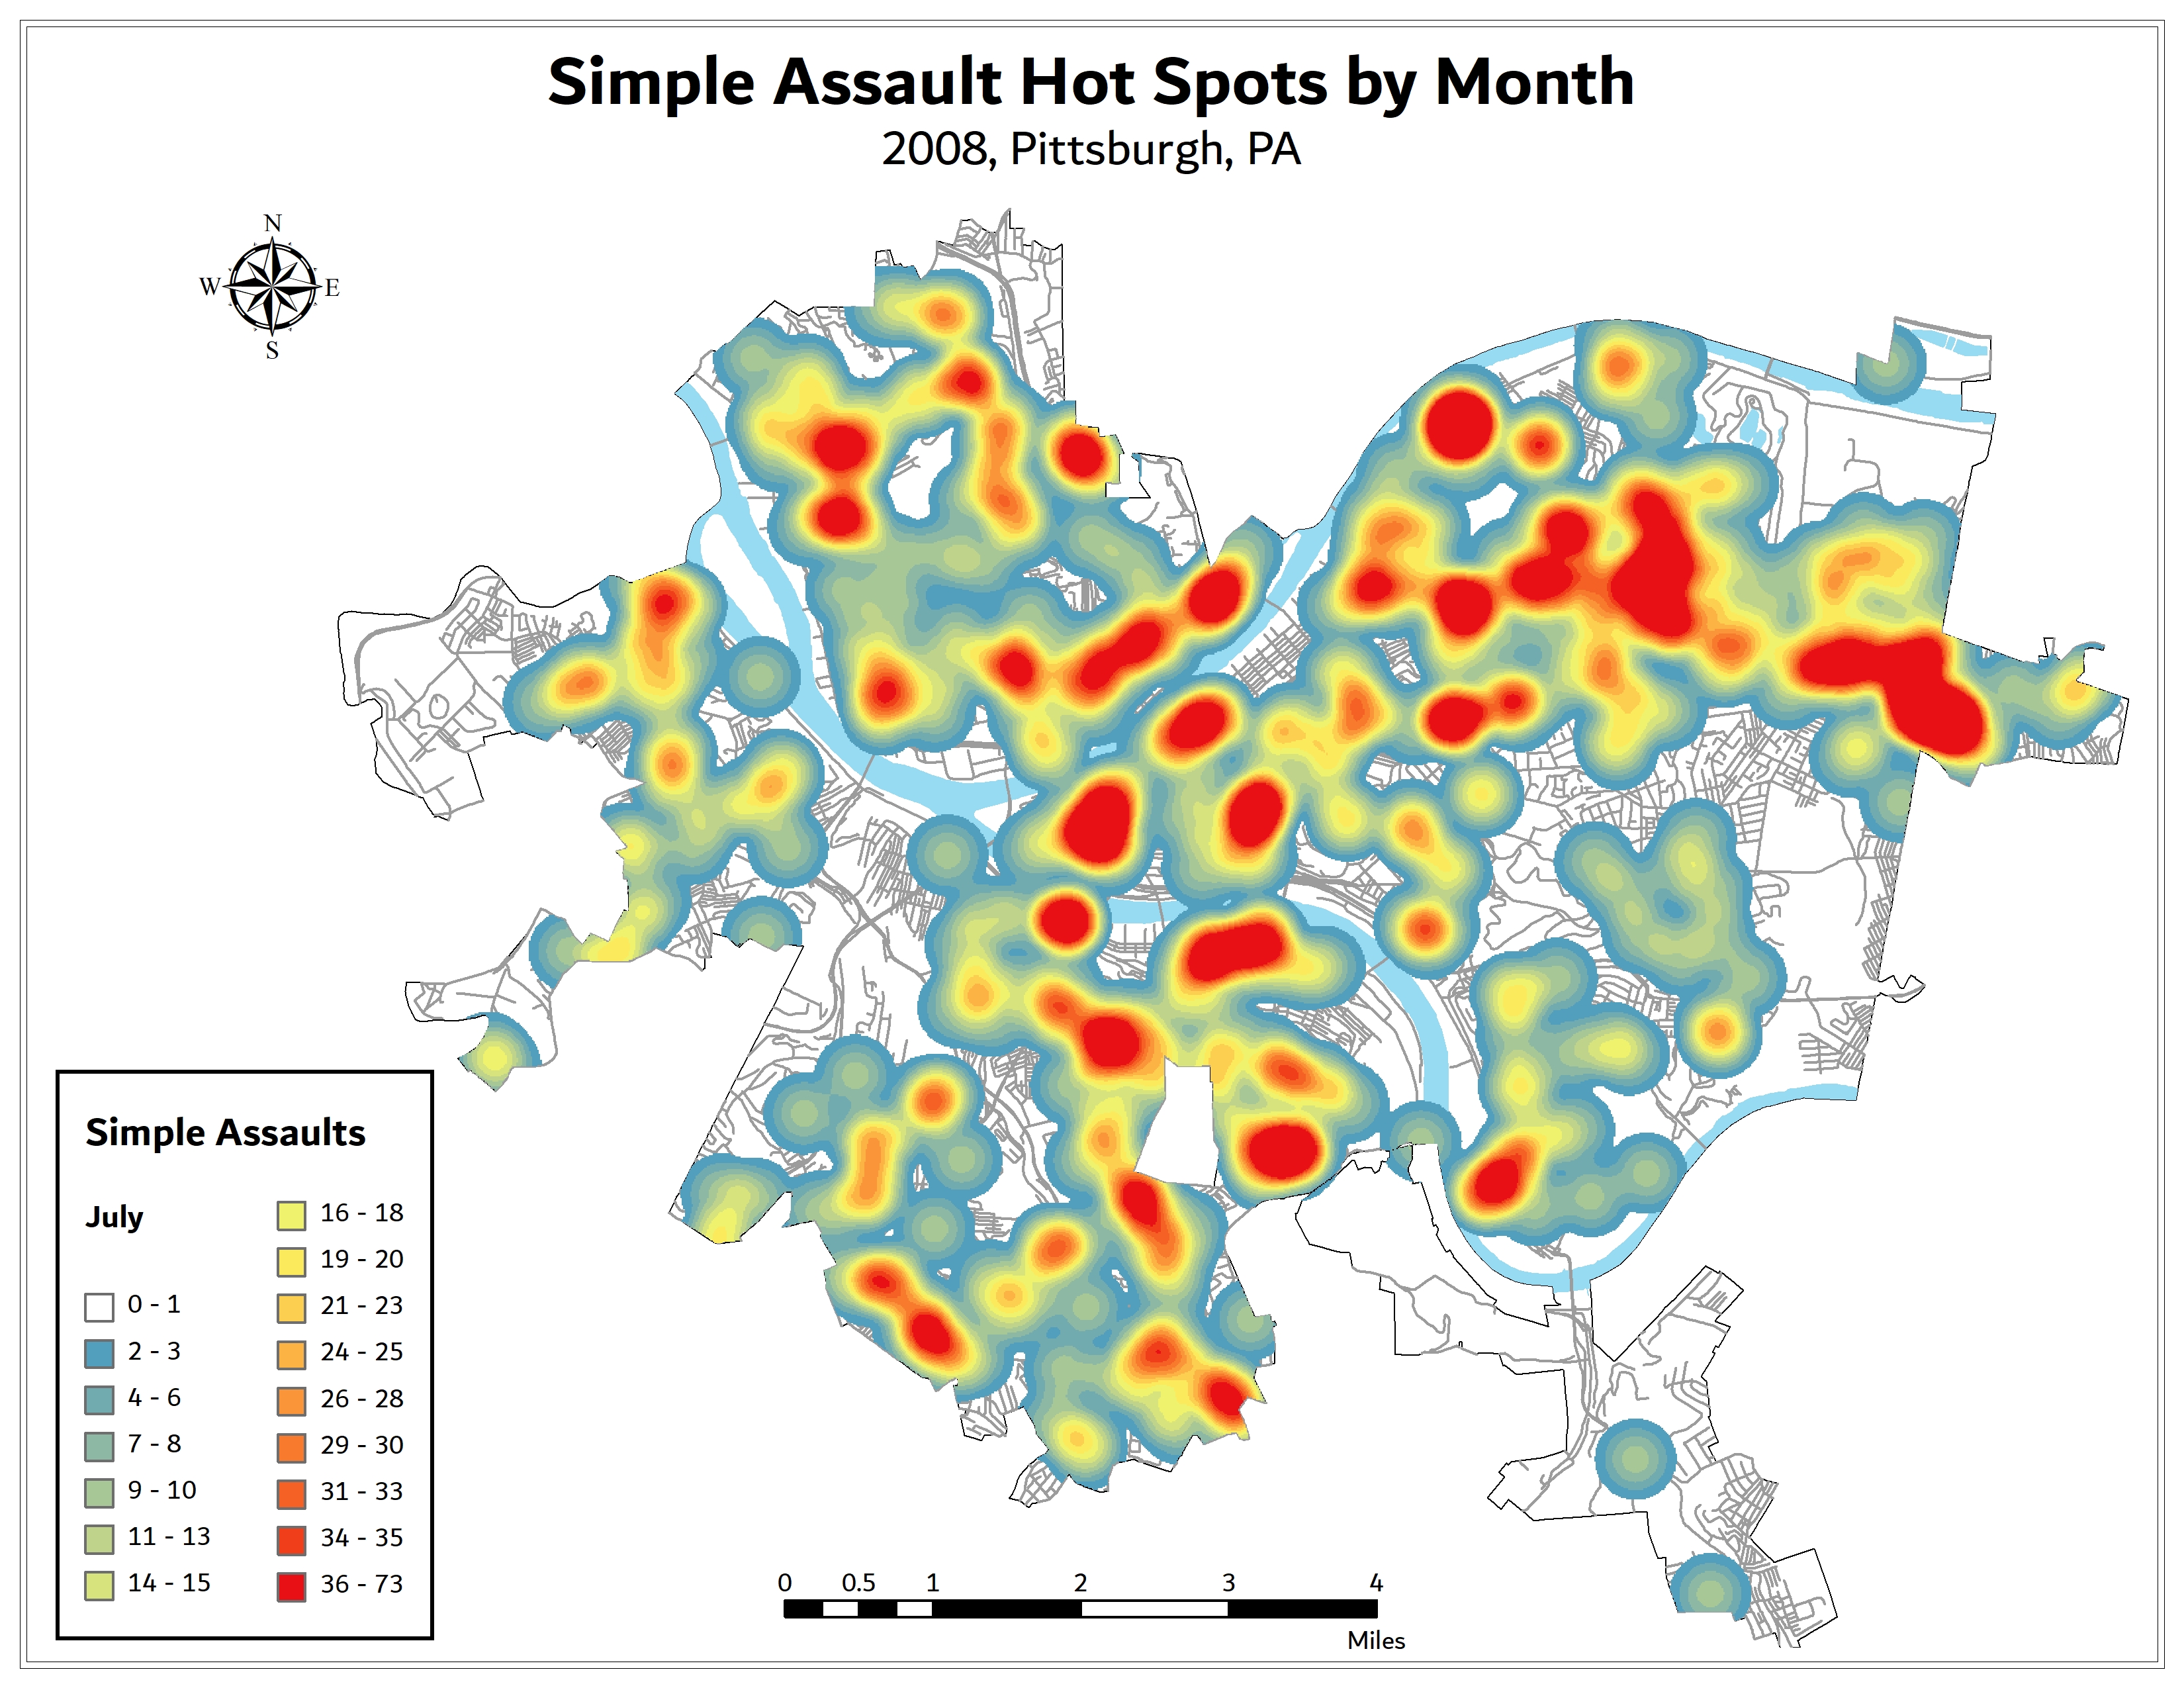
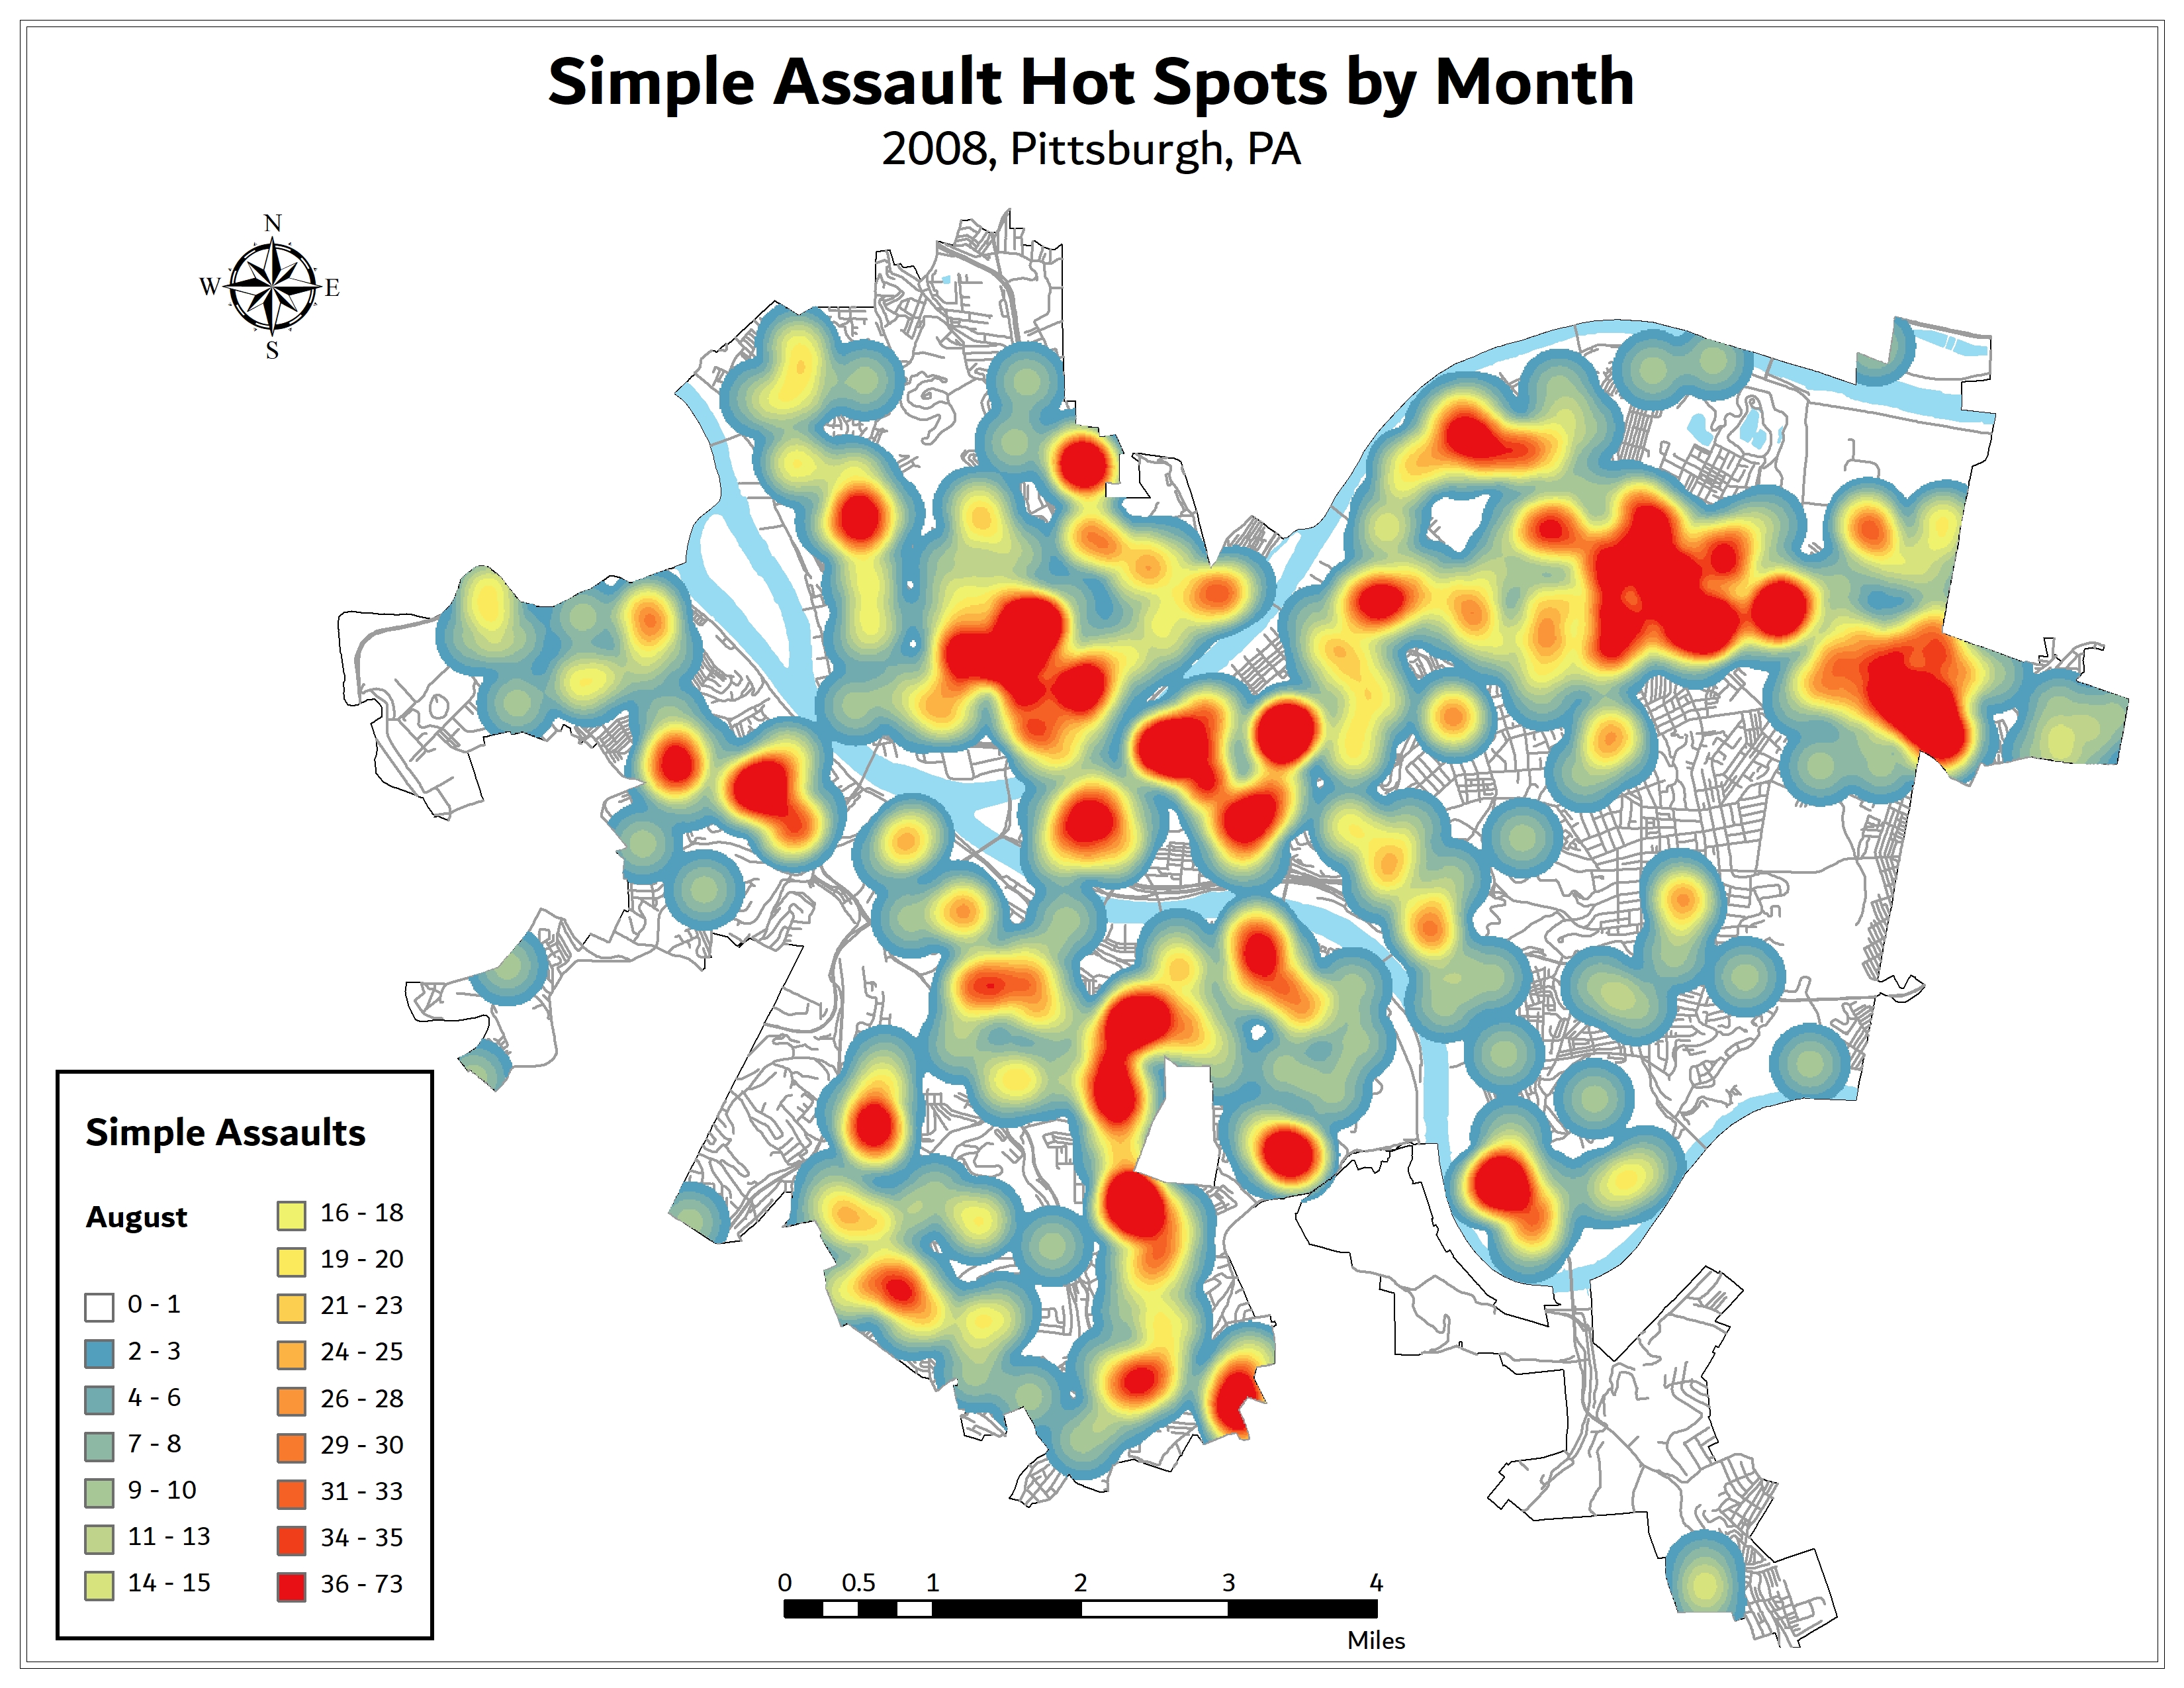
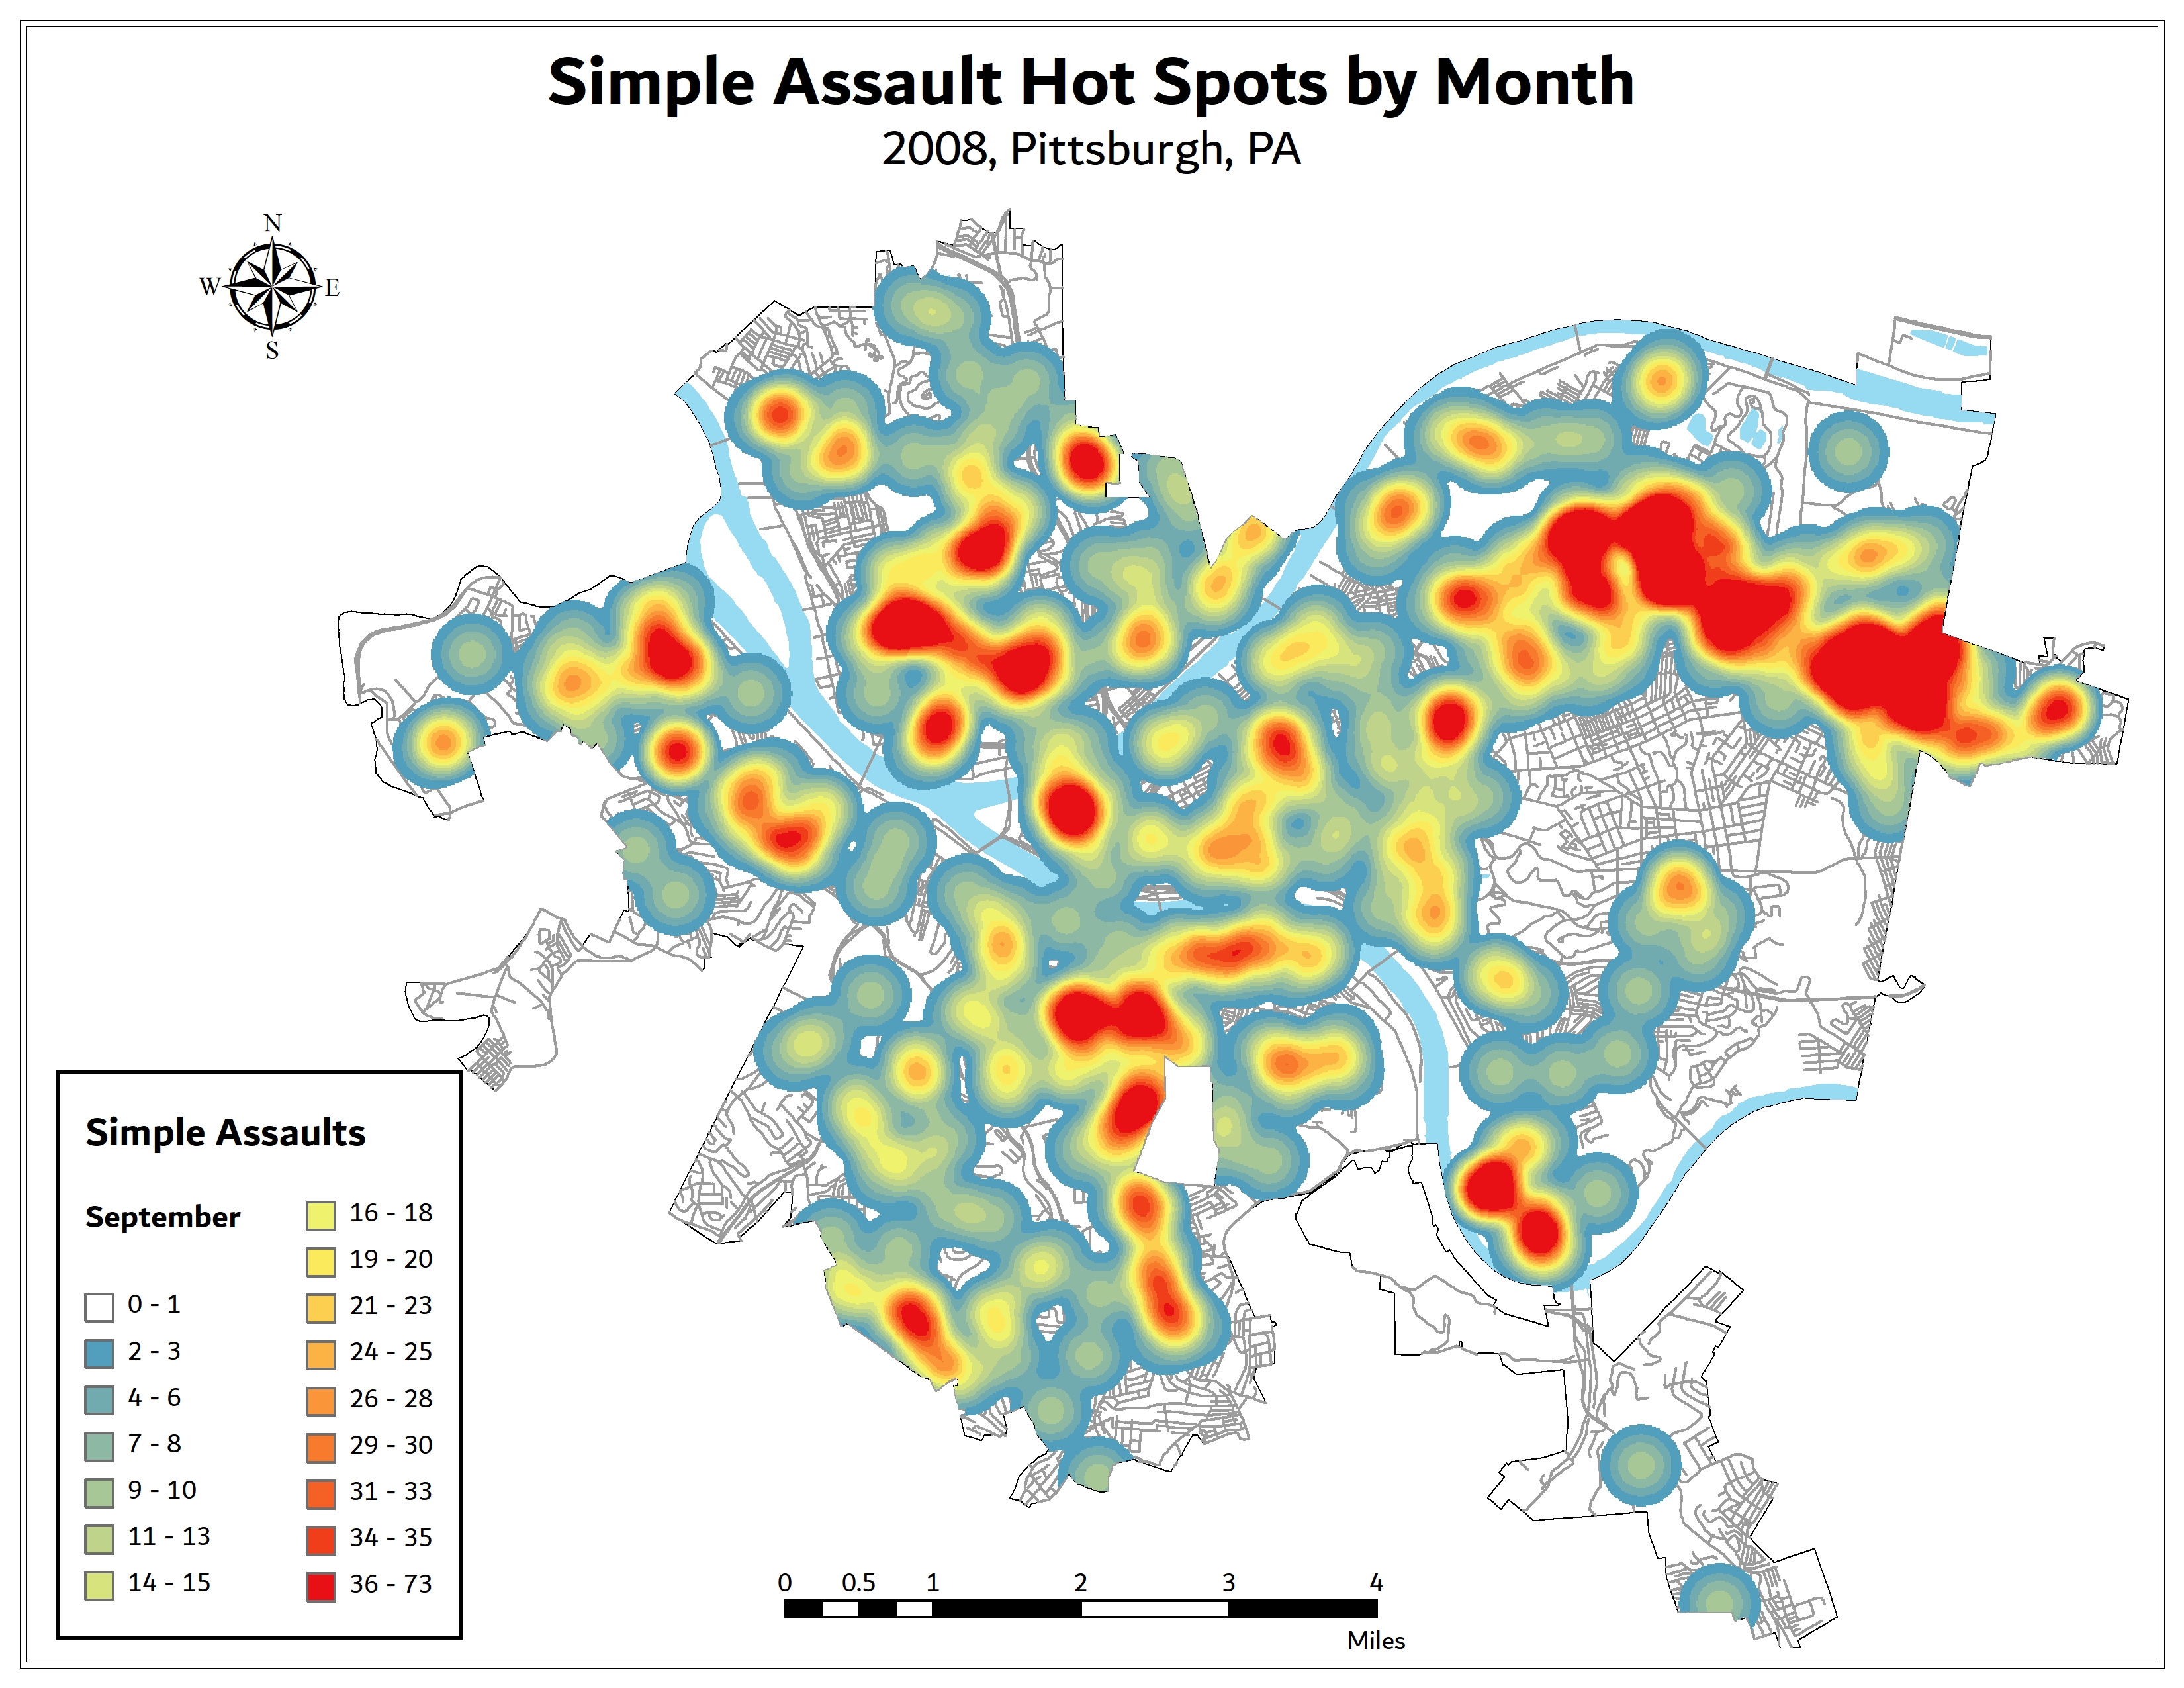
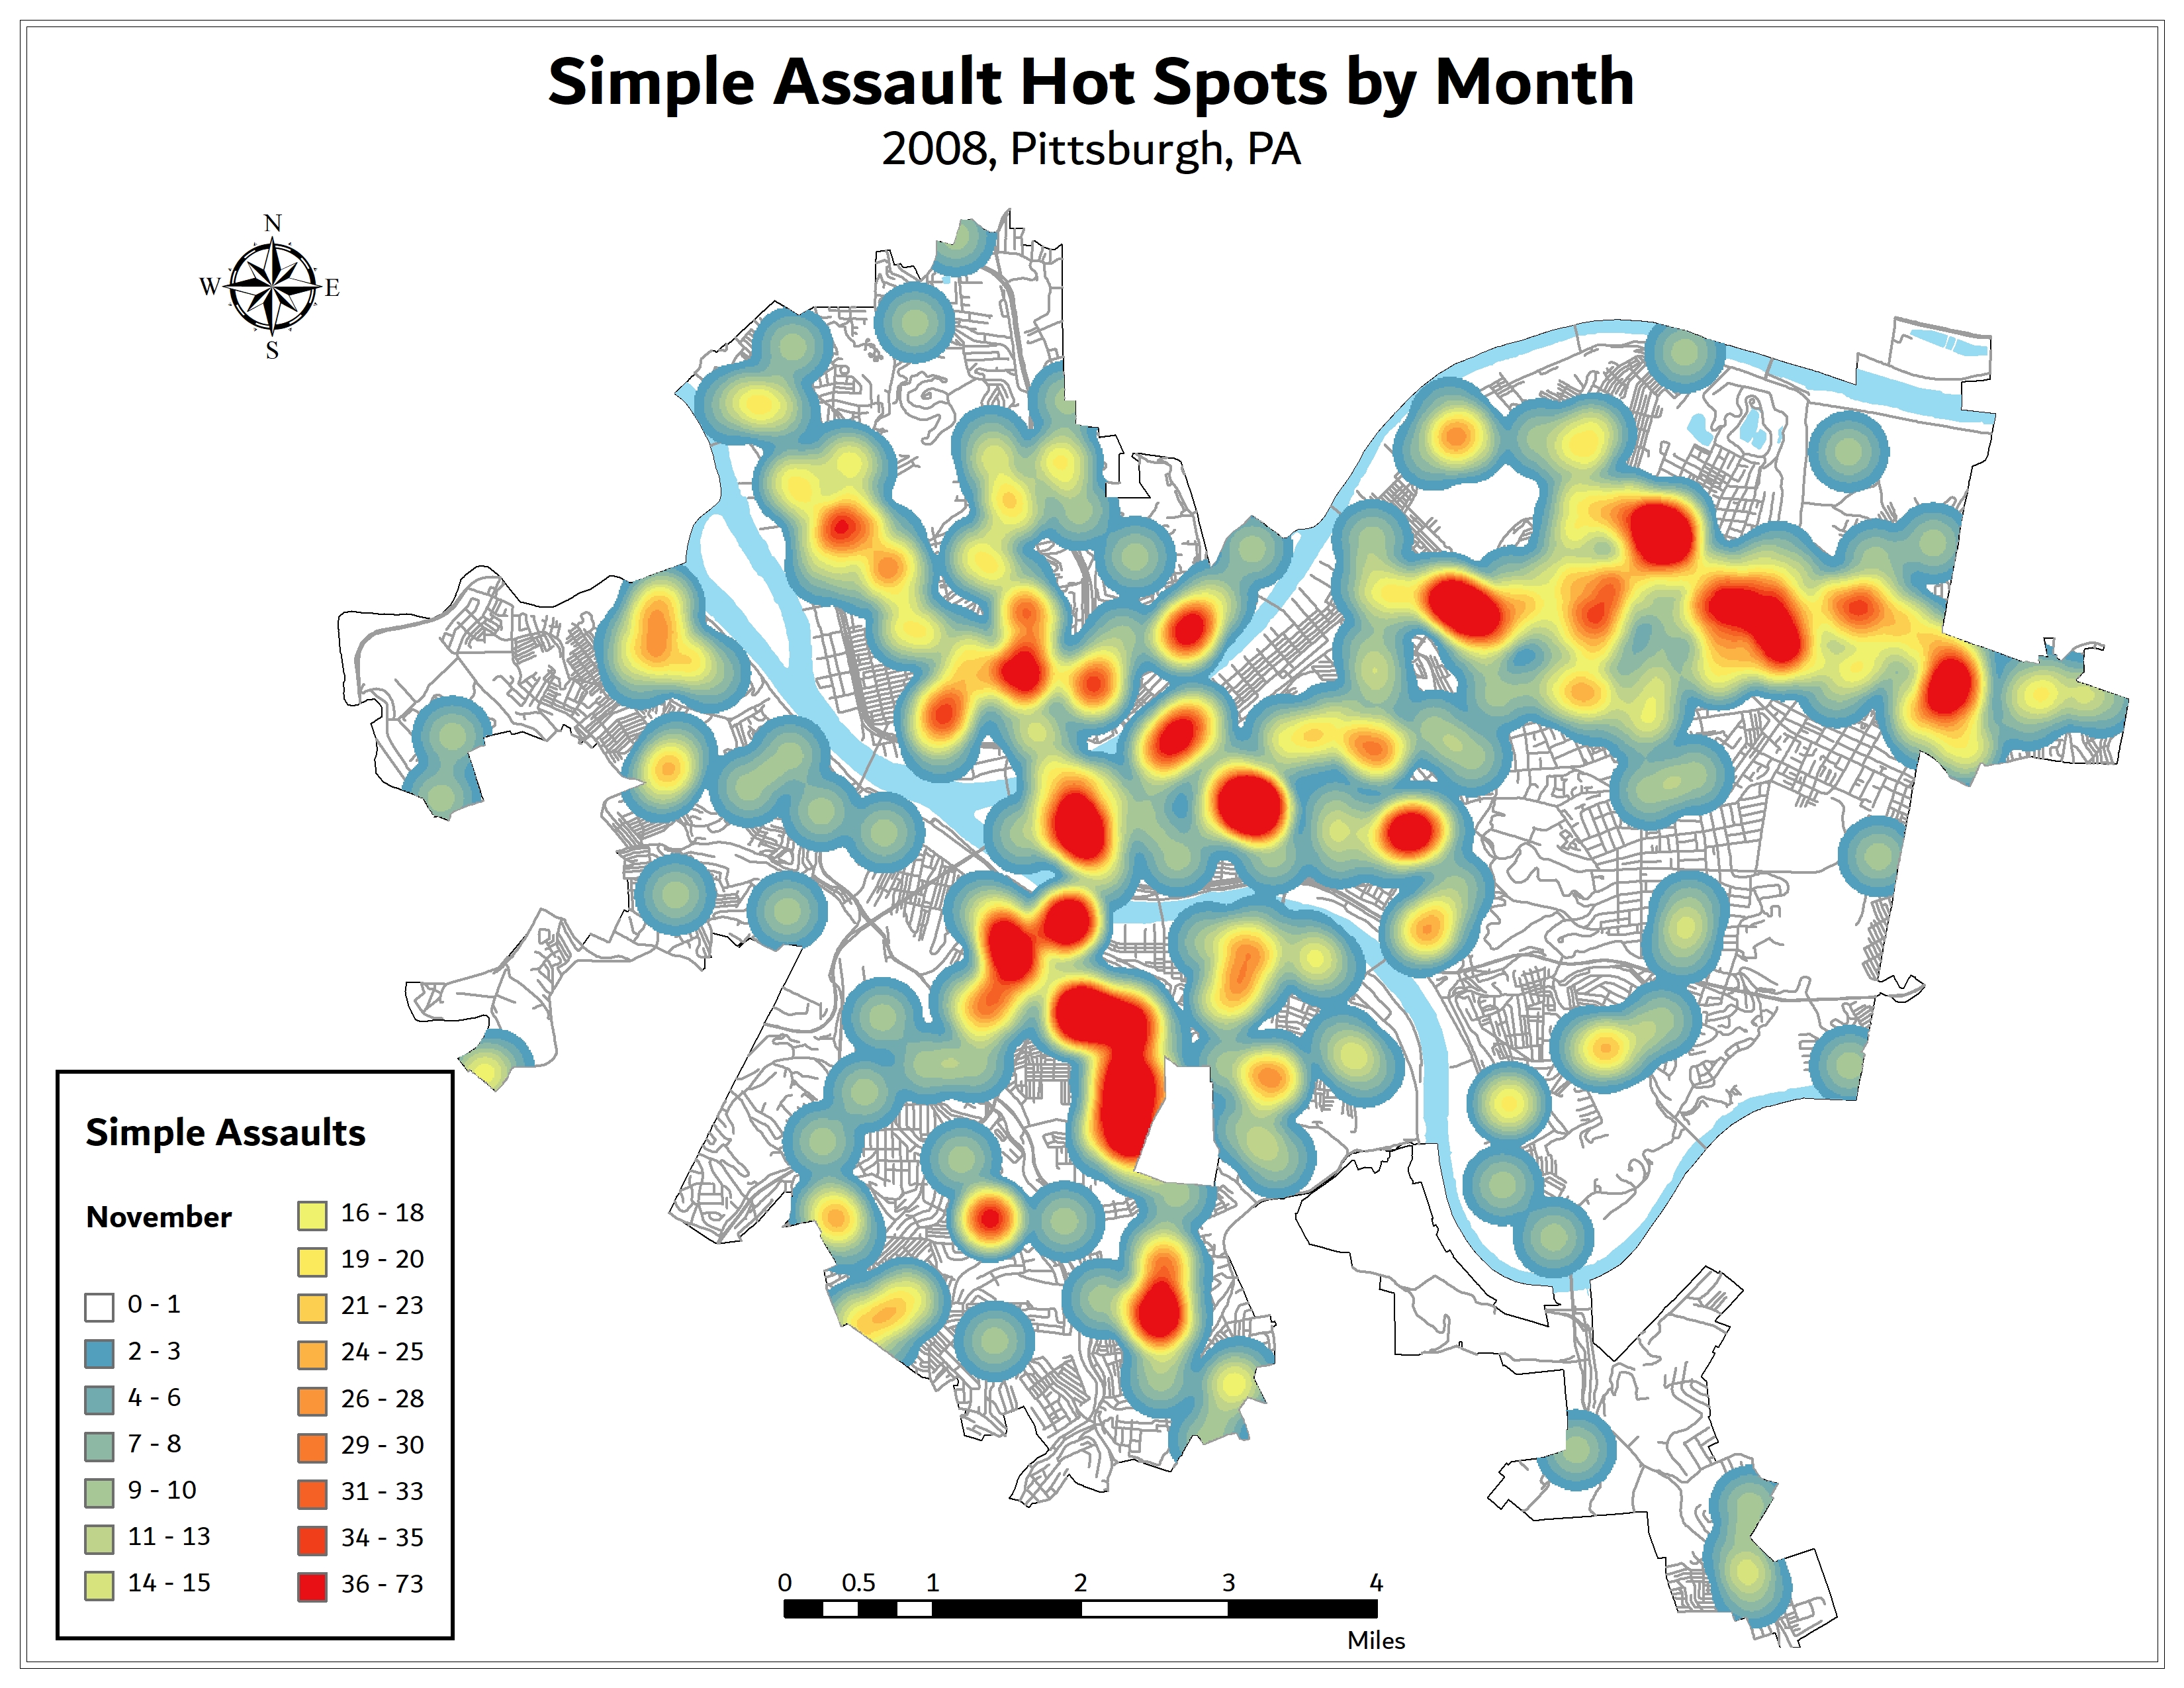
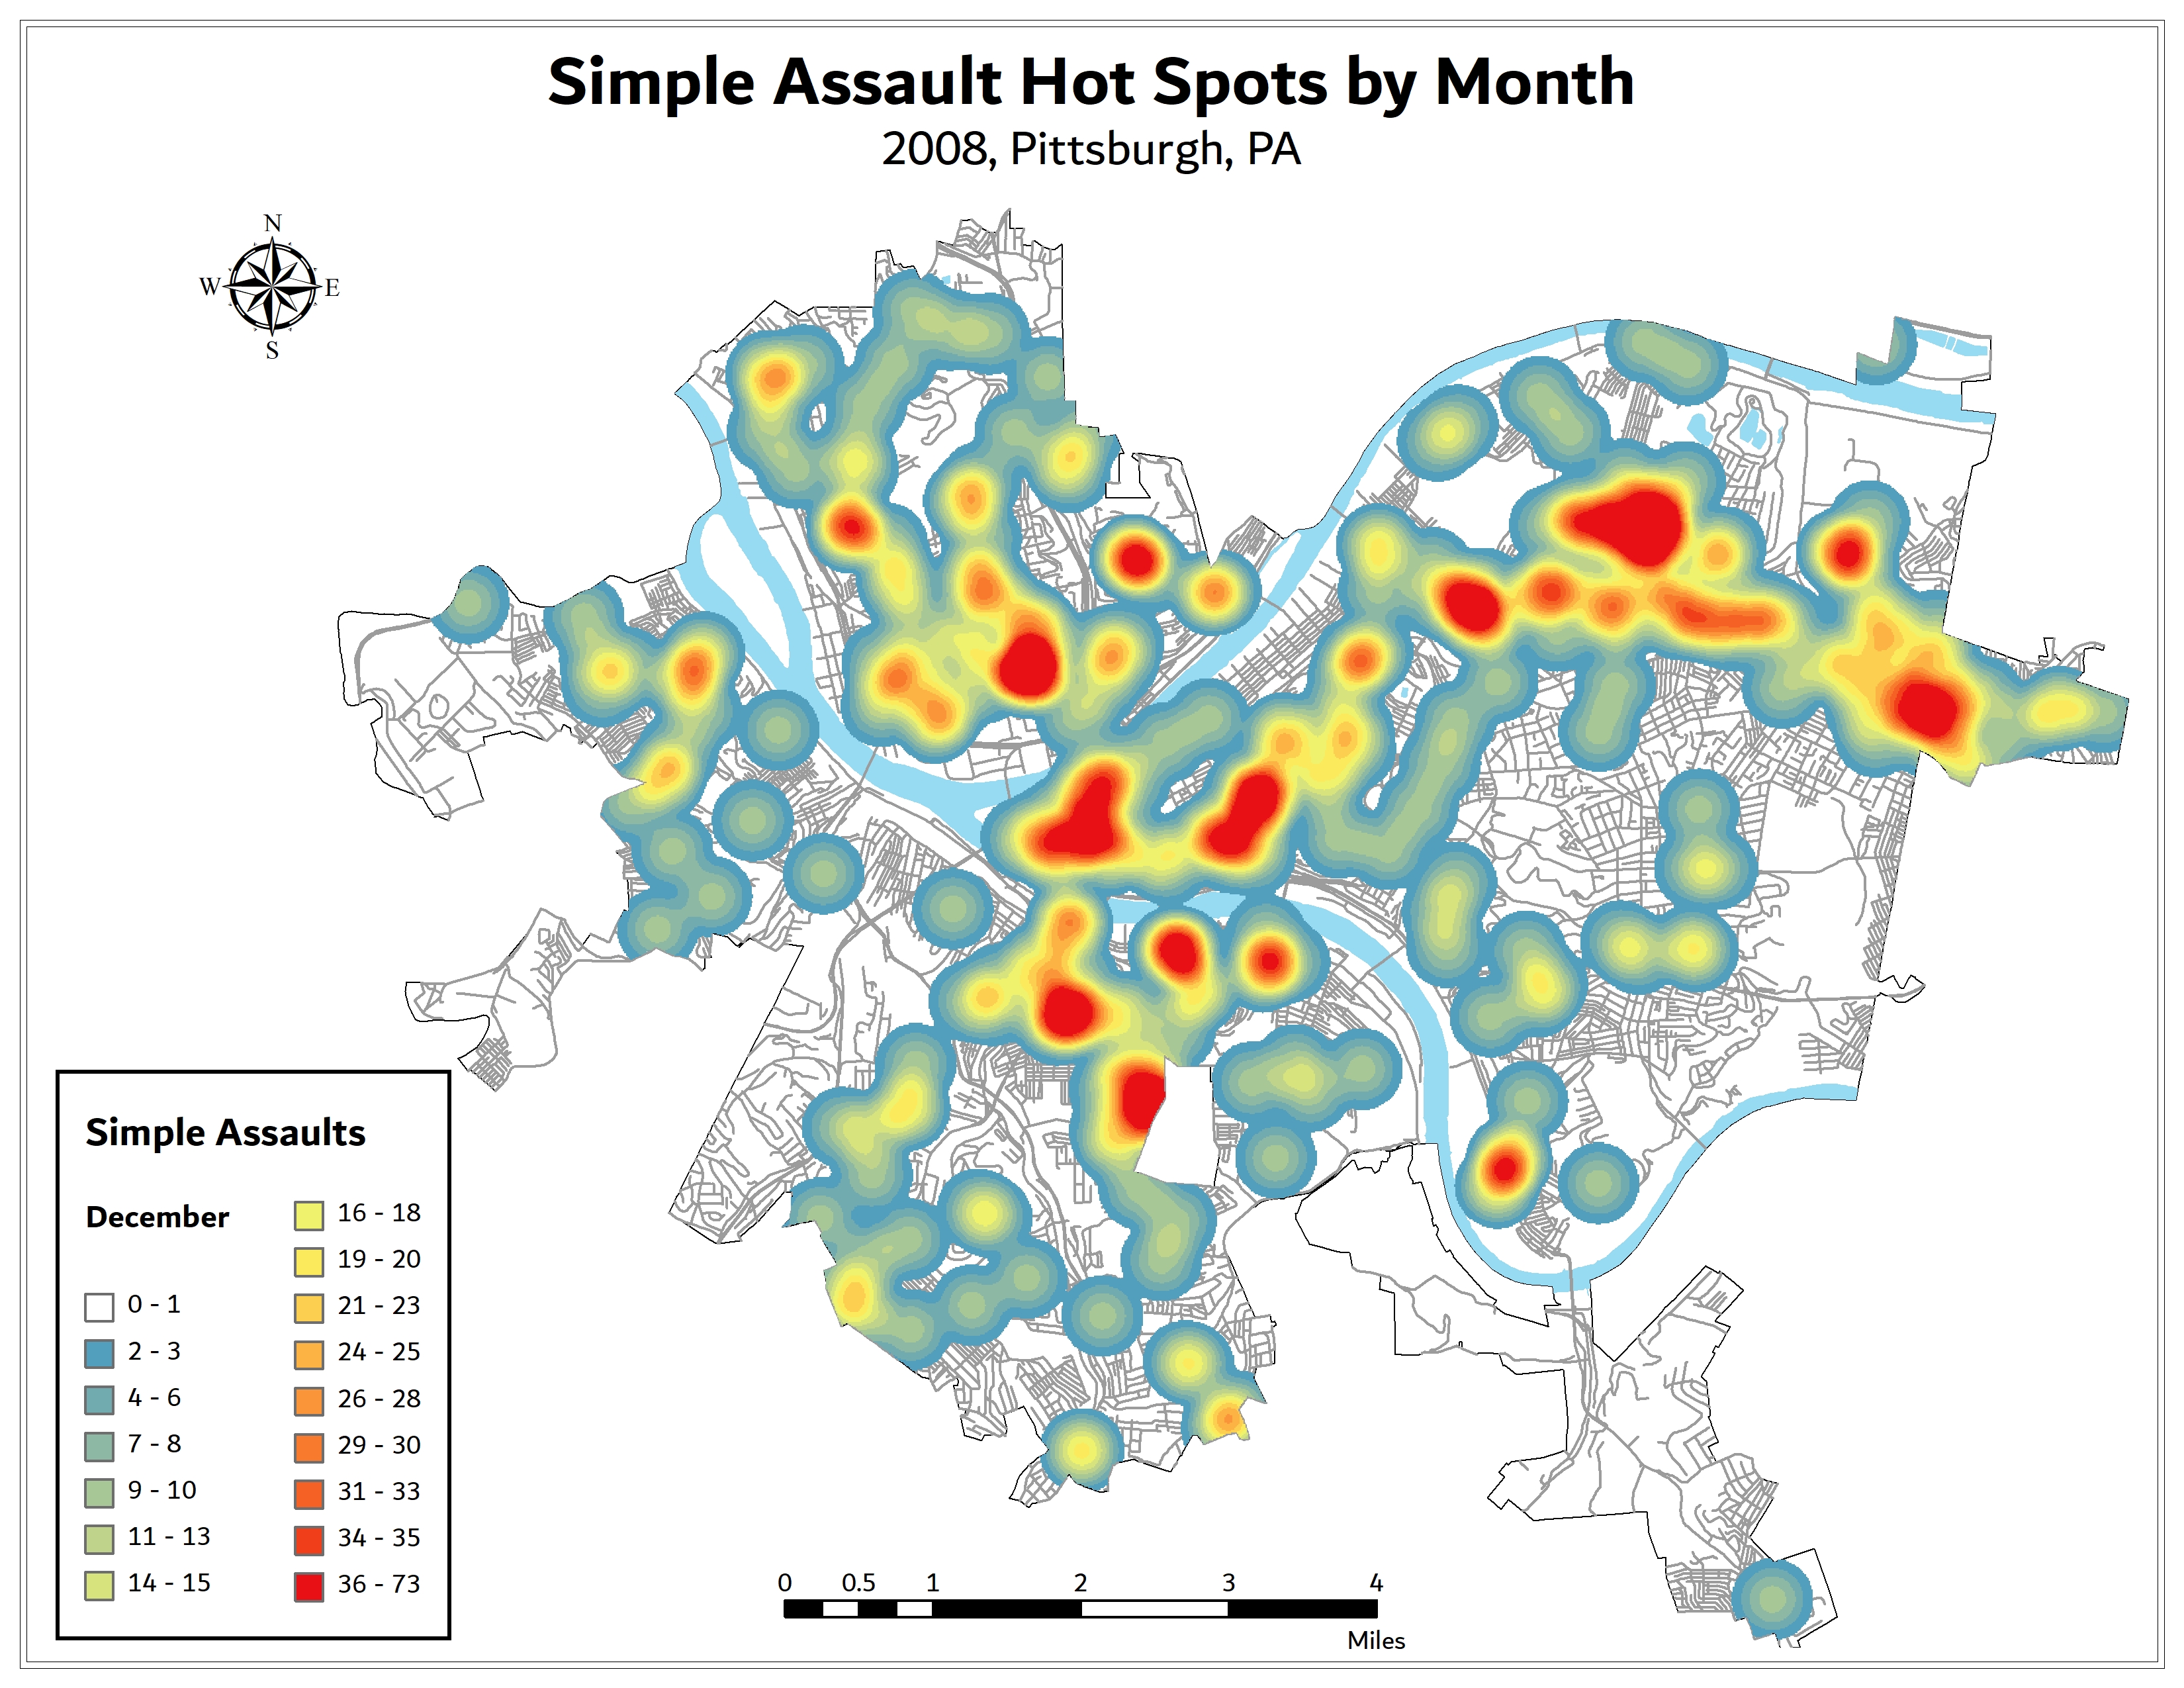
This map animation visualizes 2008 crime data in Pittsburgh, Pennsylvania. I studied whether there was any relationship between warmer temperatures and reports of simple assault in the city. Each month of 2008 is represented in a raster map showing hot spots based on a search area of 1,500 feet with a 50-foot cell size.
Static versions of all twelve maps can be found here:
January
February
March
April
May
June
July
August
September
October
November
December
This poster was created as a final project for an Applications in Public Health GIS class. It explores poverty levels in Connecticut towns and COVID-19 vaccinations as of April 7, 2021 to discover any relationships between poverty and access to a vaccine.